Splunk® Enterprise

Splunk Dashboard Studio

Splunk Enterprise version 9.0 will no longer be supported as of June 14, 2024. See the Splunk Software Support Policy for details. For information about upgrading to a supported version, see How to upgrade Splunk Enterprise.
This documentation does not apply to the most recent version of Splunk® Enterprise. For documentation on the most recent version, go to the latest release.

What is the visual editor?

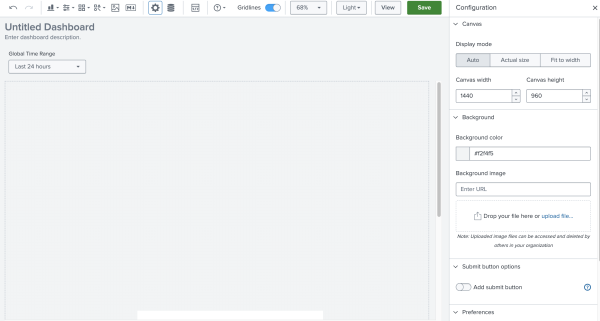
You can create and update dashboards in the visual editor. The editing toolbar in the visual editor provides visualizations to add to a dashboard, ways to create a data source, and access to the source code editor for more advanced customization. See the changes you make in the dashboard canvas and adjust the dashboard elements in the configuration panel. The configuration panel changes functionality depending on what element of the dashboard you select.

The following is a screenshot of the visual editor using absolute mode.

A blank dashboard canvas with a toolbar at the top and a configuration panel on the right. The toolbar has buttons for adding visualizations, creating a data source, and entering the source code editor for the dashboard. The configuration panel changes functionality depending on what element of the dashboard is selected.

Use the following table as a reference for all tools in the editing toolbar:

Tool Description Notes
Undo and redo (One arrow curving left and the other curving right.) Undo or redo actions while building your dashboard.
Add chart (A bar graph as an icon.) Add visualizations to your dashboard such as single value visualizations, tables, area charts, line charts, bar charts, and more.
Add input (Three horizontal sliding toggles as an icon.) Allow users to interact with your dashboard by adding inputs, such as drop-down menus and time range pickers.
Add icon (Four small squares making a larger square in a two by two configuration.) Choose from a list of popular icons, add your own custom icons, or include a single value icon. Available only in the absolute layout.
Add shape (A square, triangle, circle, and backslash configured to form a larger square.) Add rectangles, ellipses, and lines.
Add image (A mountain and sun landscape as an icon.) Upload a local image or paste a link to an image URL. Available only in the absolute layout.
Add Markdown (An uppercase letter M and an arrow pointing downward as an icon.) Add Markdown formatting to your dashboard.
Configuration (A gear as an icon.) Open/close a configuration panel to adjust dashboard preferences and canvas options.
Data overview (A cylinder as an icon.) Create or view your available data sources and searches.
Source code editor (A forward slash between two outward carrots as an icon.) View the JSON-based dashboard source code or apply options that are not available in the visual editor.
Zoom level Choose a zoom percentage. You can select Auto or Fit for automatic dashboard sizing. Available only in the absolute layout.
View or Edit Toggle between View and Edit mode to see how your changes appear in the dashboard.
Theme Choose either a Light or Dark theme.
Save Save your changes. Dashboards in Splunk Dashboard Studio do not save automatically.
Fullscreen (Two carrots pointed outwards diagonally as an icon.) View your dashboard in full screen. Press esc to exit full screen. Available only in View mode.
Actions panel Download, clone, or delete your dashboard. You can also view the dashboard on mobile or change editing permissions. Available only in View mode.

Edit mode visualization panel actions

When you select a chart or shape, an action panel appears to the right of the object. Use this panel to layer, clone, delete, or download an image of the object.

Layer objects

To move the object through the different layers of your canvas, click the layering icon shown in the following image:
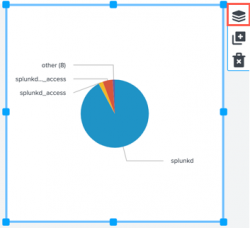
A pie chart with the layering icon highlighted in the action panel displayed.
The number of available options depends on the layer of your object. For example, if your object is on the top layer of the canvas, you can send your object back one layer, or to the first layer of the canvas. If your object is in a middle layer, you have four options:

  • To send your object forward one layer, select Move forward.
  • To send your object to the front layer, select Bring to front.
  • To send your object back one layer, select Move backward.
  • To send your object to the back to the first layer, select Send to back.

Clone an object

To clone the selected object, click the clone icon.
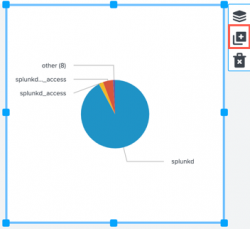
A pie chart with the clone icon highlighted in the action panel.
If you clone an object that is connected to a data source, you can use the Configuration panel to choose an existing data source, or create a new one.

Delete an object

To delete the selected object, click the delete icon:
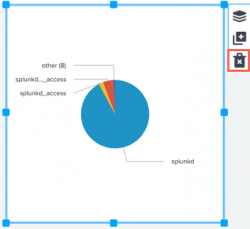
A pie chart with the delete icon highlighted in the action panel.

Access visualization source code

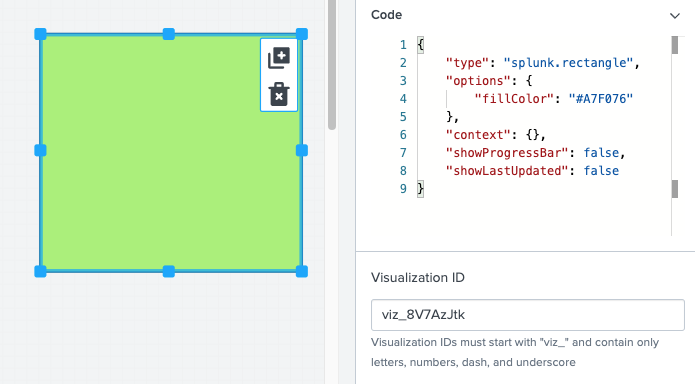
You can modify the source code of a visualization or data source in the visual editor by selecting the visualization or search and opening the code window in the Configuration panel. The changes you make will instantly affect the visualization or data source you're working with. For example:

The code panel in the visual editor.

View mode visualization panel actions

In the dashboard view mode, users can interact with a visualization by selecting it to open an action menu. Upon selecting the visualization, a menu appears in a panel at the top right corner of the visualization. The following options are available:

Open in search

Users with admin permissions can click the magnifying glass on a selected visualization to open the search driving the visualization in Search.

Open in search icon

Expand the visualization

Click the full screen icon to view the visualization panel in full screen mode. Press the escape (esc) key to exit full screen mode.

Full screen icon

Refresh the search driving the visualization

Click the refresh icon to refresh the visualization.

Refresh icon


Download a visualization

Click the download icon to download individual visualizations in PNG format.

Download icon

Last modified on 25 January, 2024
Part 11 Polish up your dashboard   Set up a dashboard

This documentation applies to the following versions of Splunk® Enterprise: 9.0.0, 9.0.1, 9.0.2, 9.0.3, 9.0.4, 9.0.5, 9.0.6, 9.0.7, 9.0.8, 9.0.9, 9.0.10, 9.1.0, 9.1.1, 9.1.2, 9.1.3, 9.1.4, 9.1.5, 9.1.6, 9.1.7


Was this topic useful?


You must be logged into splunk.com in order to post comments. Log in now.

Please try to keep this discussion focused on the content covered in this documentation topic. If you have a more general question about Splunk functionality or are experiencing a difficulty with Splunk, consider posting a question to Splunkbase Answers.

0 out of 1000 Characters