About search optimization
Search optimization is a technique for making your search run as efficiently as possible.
When not optimized, a search often runs longer, retrieves larger amounts of data from the indexes than is needed, and inefficiently uses more memory and network resources. Multiply these issues by hundreds or thousands of searches and the end result is a slow or sluggish system.
There are a set of basic principles that you can follow to optimize your searches.
- Retrieve only the required data
- Move as little data as possible
- Parallelize as much work as possible
- Set appropriate time windows
To implement the search optimization principles, use the following techniques.
- Filter as much as possible in the initial search
- Perform joins and lookups on only the required data
- Perform evaluations on the minimum number of events possible
- Move commands that bring data to the search head as late as possible in your search criteria
Indexes and searches
When you run a search, the Splunk software uses the information in the index files to identify which events to retrieve from disk. The smaller the number of events to retrieve from disk, the faster the search runs.
How you construct your search has a significant impact on the number of events retrieved from disk.
When data is indexed, the data is processed into events based on time. The processed data consists of several files:
- The raw data in compressed form (rawdata)
- The indexes that point to the raw data (index files, also referred to as tsidx files)
- Some metadata files
These files are written to disk and reside in sets of directories, organized by age, called buckets.
Use indexes effectively
One method to limit the data that is pulled off from disk is to partition data into separate indexes. If you rarely search across more than one type of data at a time, partition different types of data into separate indexes. Then restrict your searches to the specific index. For example, store web access data in one index and firewall data in another. Using separate indexes is recommended for sparse data, which might otherwise be buried in a large volume of unrelated data.
- See Ways to set up multiple indexes in the Managing Indexers and Clusters of Indexers manual
- See Retrieve events from indexes
A tale of two searches
Some frequently used searches unnecessarily consume a significant amount of system resources. You will learn how optimizing just one search can save significant system resources.
A frequently used search
One search that is frequently used is a search that contains a lookup and an evaluation, followed by another search. For example:
sourcetype=my_source
| lookup my_lookup_file D OUTPUTNEW L
| eval E=L/T
| search A=25 L>100 E>50
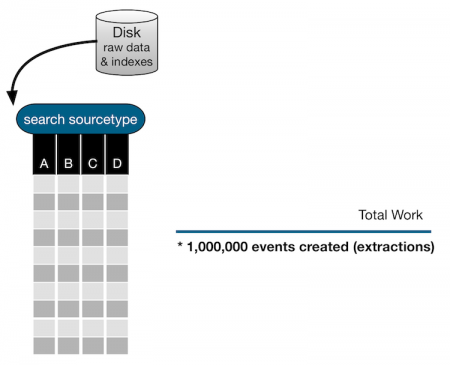
The following diagram shows a simplified, visual representation of this search.
When the search is run, the index is accessed and 1 million events are extracted based on the source type.
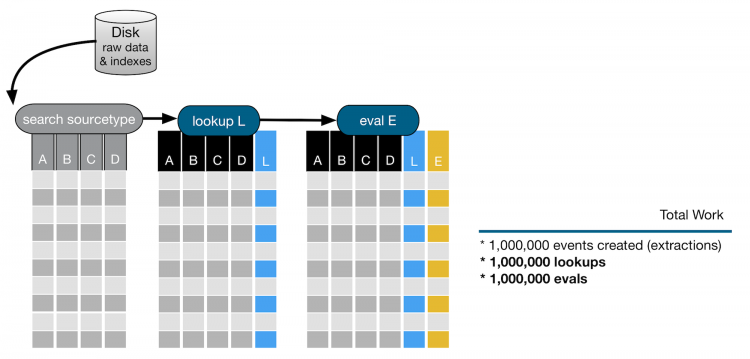
In the next part of the search, the lookup and eval command are run are on all 1 million events. Both the lookup and eval commands add columns to the events, as shown in the following image.
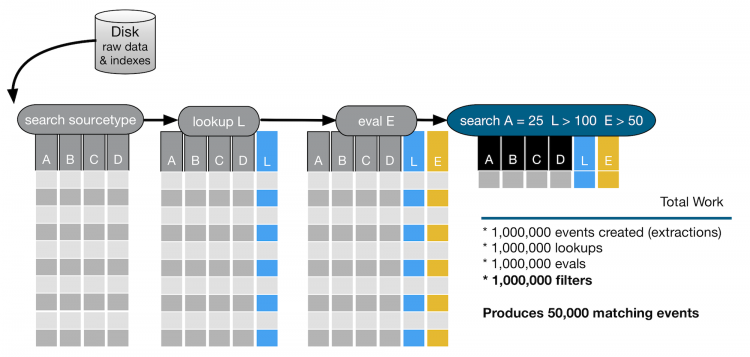
Finally, a second search command runs against the columns A, L, and E.
- For column A, the search looks for values that are equal to 25.
- For column L, which was added as a result of the
lookupcommand, the search looks for values greater than 100. - For column E, which was added as a result of the
evalcommand, the search looks for values that are greater than 50.
Events that match the criteria for columns A, L, and E are identified, and 50,000 events that match the search criteria are returned. The following image shows the entire process and the resource costs involved in this inefficient search.
An optimized search
You can optimize the entire search by moving some of the components from the second search to locations earlier in the search process.
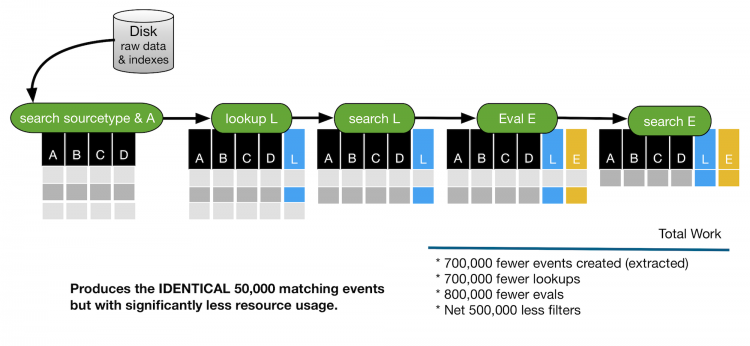
Moving the criteria A=25 before the first pipe filters the events earlier and reduces the amount of times that the index is accessed. The number of events extracted is 300,000. This is a reduction of 700,000 compared to the original search. The lookup is performed on 300,000 events instead of 1 million events.
Moving the criteria L>100 immediately after the lookup filters the events further, reducing the number of events returned by 100,000. The eval is performed on 200,000 events instead of 1 million events.
The criteria E>50 is dependent on the results of the eval command and cannot be moved. The results are the same as the original search. 50,000 events are returned, but with much less impact on resources.
This is the optimized search.
sourcetype=my_source A=25
| lookup my_lookup_file D OUTPUTNEW L
| search L>100
| eval E=L/T
| search  E>50
The following image shows the impact of rearranging the search criteria.
See also
| SPL and regular expressions | Quick tips for optimization |
This documentation applies to the following versions of Splunk® Enterprise: 7.0.0, 7.0.1, 7.0.2, 7.0.3, 7.0.4, 7.0.5, 7.0.6, 7.0.7, 7.0.8, 7.0.9, 7.0.10, 7.0.11, 7.0.13, 7.1.0, 7.1.1, 7.1.2, 7.1.3, 7.1.4, 7.1.5, 7.1.6, 7.1.7, 7.1.8, 7.1.9, 7.1.10, 7.2.0, 7.2.1, 7.2.2, 7.2.3, 7.2.4, 7.2.5, 7.2.6, 7.2.7, 7.2.8, 7.2.9, 7.2.10, 7.3.0, 7.3.1, 7.3.2, 7.3.3, 7.3.4, 7.3.5, 7.3.6, 7.3.7, 7.3.8, 7.3.9, 8.0.0, 8.0.1, 8.0.2, 8.0.3, 8.0.4, 8.0.5, 8.0.6, 8.0.7, 8.0.8, 8.0.9, 8.0.10, 8.1.0, 8.1.1, 8.1.2, 8.1.3, 8.1.4, 8.1.5, 8.1.6, 8.1.7, 8.1.8, 8.1.9, 8.1.10, 8.1.11, 8.1.12, 8.1.13, 8.1.14, 8.2.0, 8.2.1, 8.2.2, 8.2.3, 8.2.4, 8.2.5, 8.2.6, 8.2.7, 8.2.8, 8.2.9, 8.2.10, 8.2.11, 8.2.12, 9.0.0, 9.0.1, 9.0.2, 9.0.3, 9.0.4, 9.0.5, 9.0.6, 9.0.7, 9.0.8, 9.0.9, 9.0.10, 9.1.0, 9.1.1, 9.1.2, 9.1.3, 9.1.4, 9.1.5, 9.1.6, 9.1.7, 9.1.8, 9.1.9, 9.2.0, 9.2.1, 9.2.2, 9.2.3, 9.2.4, 9.2.5, 9.2.6, 9.3.0, 9.3.1, 9.3.2, 9.3.3, 9.3.4, 9.4.0, 9.4.1, 9.4.2


 Download manual
Feedback submitted, thanks!