About event grouping and correlation
Event correlation is finding relationships between seemingly unrelated events in data from multiple sources to answer questions like, "how far apart in time did a specific set of events occur?" or "what's the total amount of time it took for a transaction to complete?"
Splunk software supports event correlations using time and geographic location, transactions, sub-searches, field lookups, and joins.
- Identify relationships based on the time proximity or geographic location of the events. Use this correlation in any security or operations investigation, where you might need to see all or any subset of events that take place over a given time period or location.
- Track a series of related events, which may come from separate IT systems and data sources, together as a single transaction. Identify the amount of time it took to complete the transaction and the number of events within a single transaction.
- Use a sub-search to take the results of one search and use them in another. Create conditional searches, where you see the results of a search only if the sub-search meets certain thresholds.
- Correlate your data to external sources with lookups.
- Use SQL-like inner and outer joins to link two completely different data sets together based on one or more common fields.
This chapter discusses three methods for correlating or grouping events:
- Use time to identify relations between events
- Use subsearch to correlate events
- Use transactions to identify and group related events
You can also use field lookups and other features of the search language. Depending on your search criteria and how you want to define your groupings, you may be able to use a search command, such as append, associate, contingency, join, or stats. Sometimes, there is no single command that you can use.
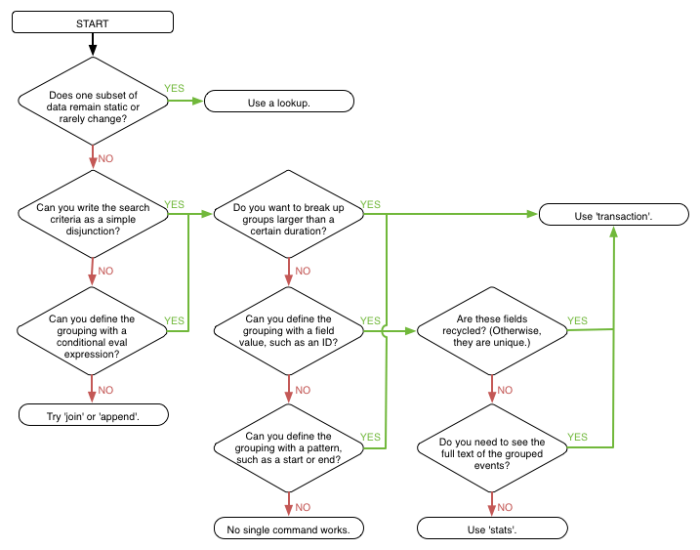
If you're not sure where to start, the following flow chart can help you decide whether to use a lookup, define a transaction, or try another search command to define your event grouping.
In most cases, you can accomplish more with the stats command or the transaction command; and these are recommended over using the join and append commands. You can read more about when to use stats and transaction in the topic "About transactions" later in this chapter. You can also read more about the stats commands in the "Calculate Statistics" chapter of this manual.
Note: The information for this diagram was provided by Nick Mealy.
| Machine Learning | Use time to identify relationships between events |
This documentation applies to the following versions of Splunk® Enterprise: 7.0.0, 7.0.1, 7.0.2, 7.0.3, 7.0.4, 7.0.5, 7.0.6, 7.0.7, 7.0.8, 7.0.9, 7.0.10, 7.0.11, 7.0.13, 7.1.0, 7.1.1, 7.1.2, 7.1.3, 7.1.4, 7.1.5, 7.1.6, 7.1.7, 7.1.8, 7.1.9, 7.1.10, 7.2.0, 7.2.1, 7.2.2, 7.2.3, 7.2.4, 7.2.5, 7.2.6, 7.2.7, 7.2.8, 7.2.9, 7.2.10, 7.3.0, 7.3.1, 7.3.2, 7.3.3, 7.3.4, 7.3.5, 7.3.6, 7.3.7, 7.3.8, 7.3.9, 8.0.0, 8.0.1, 8.0.2, 8.0.3, 8.0.4, 8.0.5, 8.0.6, 8.0.7, 8.0.8, 8.0.9, 8.0.10, 8.1.0, 8.1.1, 8.1.2, 8.1.3, 8.1.4, 8.1.5, 8.1.6, 8.1.7, 8.1.8, 8.1.9, 8.1.10, 8.1.11, 8.1.12, 8.1.13, 8.1.14, 8.2.0, 8.2.1, 8.2.2, 8.2.3, 8.2.4, 8.2.5, 8.2.6, 8.2.7, 8.2.8, 8.2.9, 8.2.10, 8.2.11, 8.2.12, 9.0.0, 9.0.1, 9.0.2, 9.0.3, 9.0.4, 9.0.5, 9.0.6, 9.0.7, 9.0.8, 9.0.9, 9.0.10, 9.1.0, 9.1.1, 9.1.2, 9.1.3, 9.1.4, 9.1.5, 9.1.6, 9.1.7, 9.1.8, 9.1.9, 9.2.0, 9.2.1, 9.2.2, 9.2.3, 9.2.4, 9.2.5, 9.2.6, 9.3.0, 9.3.1, 9.3.2, 9.3.3, 9.3.4, 9.4.0, 9.4.1, 9.4.2

 Download manual
Feedback submitted, thanks!