Creating a dashboard in the Analytics Workspace
Your team runs the online store for buttercupgames.com. This website sells games online and tracks system metrics and logs from its online credit card payment service.
To get the most insight from your metrics, you want to set up a dashboard to monitor this data in real-time.
You have the following metrics:
- Number of transactions over time
- Overall revenue over time
- Number of errors for the store and payment service
View each of your metrics as time series in the Analytics Workspace. Then save the charts to a dashboard in the Analytics Workspace.
- View number of transactions over time
- View overall revenue over time
- View number of errors for the store and payment service
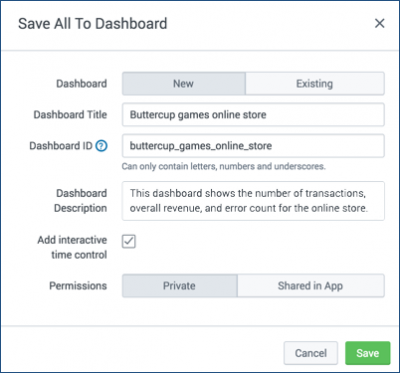
- Save the workspace to a dashboard
View number of transactions over time
- In the Data panel, search or browse for the
posted_paymentsdataset. This dataset contains the payment logs from your credit card payment provider. - Select the
transaction_idfield to create a chart. - In the Analysis panel, select the Count aggregation. Note that because the
transaction_iddataset field is a string, the only available aggregations are Count and Distinct count.
View overall revenue over time
- In the Data panel, select the
amountfield from theposted_paymentsdataset. This creates a chart of your revenue. - In the Analysis panel, change the aggregation to Sum. The chart updates to show your aggregated total revenue over time.
View number of errors for the store and payment service
- In the Data panel, search for
err. The data hierarchy filters to include only data sources with names that containerr. - Select the
err_countmetric to create a chart. - In the Analysis panel, under Split By, select the
pagedimension. This splits the chart to show errors by page. - Under Filters, click + Add New Filter. Select the
pagedimension. Then select thehome,purchase, andreviewpages. The chart shows errors from these three pages.
Save the workspace to a dashboard
- From the global actions bar, click the ellipsis (
 ) icon and select Save to Dashboard (XML).
 - Enter the dashboard details. Leave the Add interactive time control option selected, so that you can adjust the time range later.
- Click Save.
Summary
You now have a dashboard that monitors the number of transactions over time, overall revenue over time, and the number of store and payment service errors. To view your dashboard, click the Dashboard tab on the Search & Reporting bar. Then select the dashboard from the list.
For more information about dashboards in the Splunk platform, see the Dashboard overview in the Dashboards and Visualizations Manual.
For more information about dashboards in the Analytics Workspace, see Dashboards in the Analytics Workspace.
| Analyzing data in the Analytics Workspace | Troubleshoot the Analytics Workspace |
This documentation applies to the following versions of Splunk® Enterprise: 8.1.0, 8.1.1, 8.1.2, 8.1.3, 8.1.4, 8.1.5, 8.1.6, 8.1.7, 8.1.8, 8.1.9, 8.1.10, 8.1.11, 8.1.12, 8.1.13, 8.1.14, 8.2.0, 8.2.1, 8.2.2, 8.2.3, 8.2.4, 8.2.5, 8.2.6, 8.2.7, 8.2.8, 8.2.9, 8.2.10, 8.2.11, 8.2.12, 9.0.0, 9.0.1, 9.0.2, 9.0.3, 9.0.4, 9.0.5, 9.0.6, 9.0.7, 9.0.8, 9.0.9, 9.0.10, 9.1.0, 9.1.1, 9.1.2, 9.1.3, 9.1.4, 9.1.5, 9.1.6, 9.1.7, 9.1.8, 9.1.9, 9.2.0, 9.2.1, 9.2.2, 9.2.3, 9.2.4, 9.2.5, 9.2.6, 9.3.0, 9.3.1, 9.3.2, 9.3.3, 9.3.4, 9.4.0, 9.4.1, 9.4.2


 Download manual
Feedback submitted, thanks!