How indexing works
Splunk Enterprise can index any type of time-series data (data with timestamps). When Splunk Enterprise indexes data, it breaks it into events, based on the timestamps.
The indexing process follows the same sequence of steps for both events indexes and metrics indexes.
Event processing and the data pipeline
Data enters the indexer and proceeds through a pipeline where event processing occurs. Finally, the processed data it is written to disk. This pipeline consists of several shorter pipelines that are strung together. A single instance of this end-to-end data pipeline is called a pipeline set.
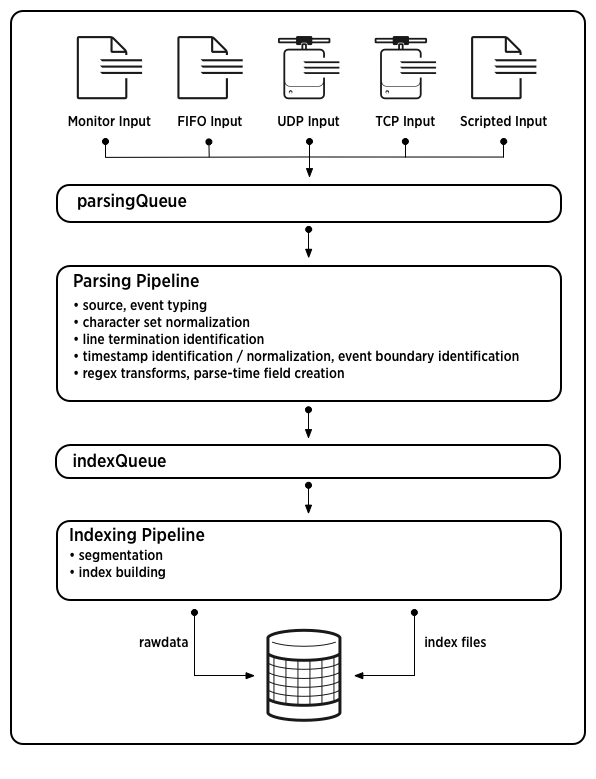
Event processing occurs in two main stages, parsing and indexing. All data that comes into Splunk Enterprise enters through the parsing pipeline as large (10,000 bytes) chunks. During parsing, Splunk Enterprise breaks these chunks into events which it hands off to the indexing pipeline, where final processing occurs.
While parsing, Splunk Enterprise performs a number of actions, including:
- Extracting a set of default fields for each event, including
host,source, andsourcetype. - Configuring character set encoding.
- Identifying line termination using linebreaking rules. While many events are short and only take up a line or two, others can be long.
- Identifying timestamps or creating them if they don't exist. At the same time that it processes timestamps, Splunk identifies event boundaries.
- Splunk can be set up to mask sensitive event data (such as credit card or social security numbers) at this stage. It can also be configured to apply custom metadata to incoming events.
In the indexing pipeline, Splunk Enterprise performs additional processing, including:
- Breaking all events into segments that can then be searched upon. You can determine the level of segmentation, which affects indexing and searching speed, search capability, and efficiency of disk compression.
- Building the index data structures.
- Writing the raw data and index files to disk, where post-indexing compression occurs.
Note: The term "indexing" is also used in a more general sense to refer to the entirety of event processing, encompassing both the parsing pipeline and the indexing pipeline. The differentation between the parsing and indexing pipelines is of relevance mainly when deploying heavy forwarders.
Heavy forwarders can run raw data through the parsing pipeline and then forward the parsed data on to indexers for final indexing. Universal forwarders do not parse data in this way. Instead, universal forwarders forward the raw data to the indexer, which then processes it through both pipelines.
Note that both types of forwarders do perform a type of parsing on certain structured data. See Extract data from files with headers in Getting Data In.
For more information about events and how the indexer transforms data into events, see the chapter Configure event processing in Getting Data In.
This diagram shows the main processes inherent in indexing:
Note: This diagram represents a simplified view of the indexing architecture. It provides a functional view of the architecture and does not fully describe Splunk Enterprise internals. In particular, the parsing pipeline actually consists of three pipelines: parsing, merging, and typing, which together handle the parsing function. The distinction can matter during troubleshooting, but does not generally affect how you configure or deploy Splunk Enterprise.
For a more detailed discussion of the data pipeline and how it affects deployment decisions, see How data moves through Splunk Enterprise: the data pipeline in Distributed Deployment.
What's in an index?
Splunk Enterprise stores the data it processes in indexes. An index consists of a collection of subdirectories, called buckets. Buckets consist mainly of two types of files: rawdata files and index files. See How Splunk Enterprise stores indexes.
Immutability of indexed data
Once data has been added to an index, you cannot edit or otherwise change the data. You can delete all data from an index or you can delete, and optionally archive, individual index buckets based on policy, but you cannot selectively delete individual events from storage.
See Remove indexes and indexed data.
Default set of indexes
Splunk Enterprise comes with a number of preconfigured indexes, including:
- main: This is the default Splunk Enterprise index. All processed data is stored here unless otherwise specified.
- _internal: Stores Splunk Enterprise internal logs and processing metrics.
- _audit: Contains events related to the file system change monitor, auditing, and all user search history.
A Splunk Enterprise administrator can create new indexes, edit index properties, remove unwanted indexes, and relocate existing indexes. Splunk Enterprise administrators manage indexes through Splunk Web, the CLI, and configuration files such as indexes.conf. See Managing indexes.
| Indexes, indexers, and indexer clusters | Index time versus search time |
This documentation applies to the following versions of Splunk® Enterprise: 7.0.0, 7.0.1, 7.0.2, 7.0.3, 7.0.4, 7.0.5, 7.0.6, 7.0.7, 7.0.8, 7.0.9, 7.0.10, 7.0.11, 7.0.13, 7.1.0, 7.1.1, 7.1.2, 7.1.3, 7.1.4, 7.1.5, 7.1.6, 7.1.7, 7.1.8, 7.1.9, 7.1.10, 7.2.0, 7.2.1, 7.2.2, 7.2.3, 7.2.4, 7.2.5, 7.2.6, 7.2.7, 7.2.8, 7.2.9, 7.2.10, 7.3.0, 7.3.1, 7.3.2, 7.3.3, 7.3.4, 7.3.5, 7.3.6, 7.3.7, 7.3.8, 7.3.9, 8.0.0, 8.0.1, 8.0.2, 8.0.3, 8.0.4, 8.0.5, 8.0.6, 8.0.7, 8.0.8, 8.0.9, 8.0.10, 8.1.0, 8.1.1, 8.1.2, 8.1.3, 8.1.4, 8.1.5, 8.1.6, 8.1.7, 8.1.8, 8.1.9, 8.1.10, 8.1.11, 8.1.12, 8.1.13, 8.1.14, 8.2.0, 8.2.1, 8.2.2, 8.2.3, 8.2.4, 8.2.5, 8.2.6, 8.2.7, 8.2.8, 8.2.9, 8.2.10, 8.2.11, 8.2.12, 9.0.0, 9.0.1, 9.0.2, 9.0.3, 9.0.4, 9.0.5, 9.0.6, 9.0.7, 9.0.8, 9.0.9, 9.0.10, 9.1.0, 9.1.1, 9.1.2, 9.1.3, 9.1.4, 9.1.5, 9.1.6, 9.1.7, 9.1.8, 9.2.0, 9.2.1, 9.2.2, 9.2.3, 9.2.4, 9.2.5, 9.3.0, 9.3.1, 9.3.2, 9.3.3, 9.4.0, 9.4.1

 Download manual
Feedback submitted, thanks!