How handles your data
consumes data and indexes it, transforming it into searchable knowledge in the form of events. The data pipeline shows the main processes that act on the data during indexing. These processes constitute event processing. After the data is processed into events, you can associate the events with knowledge objects to enhance their usefulness.
The data pipeline
Incoming data moves through the data pipeline. For more detailed information, see How data moves through Splunk deployments: The data pipeline in the Distributed Deployment Manual.
Each processing component resides on one of the three typical processing tiers: the data input tier, the indexing tier, and the search management tier. Together, the tiers support the processes occurring in the data pipeline.
As data moves along the data pipeline, components transform the data from its origin in external sources, such as log files and network feeds, into searchable events that encapsulate valuable knowledge.
The data pipeline has these segments:
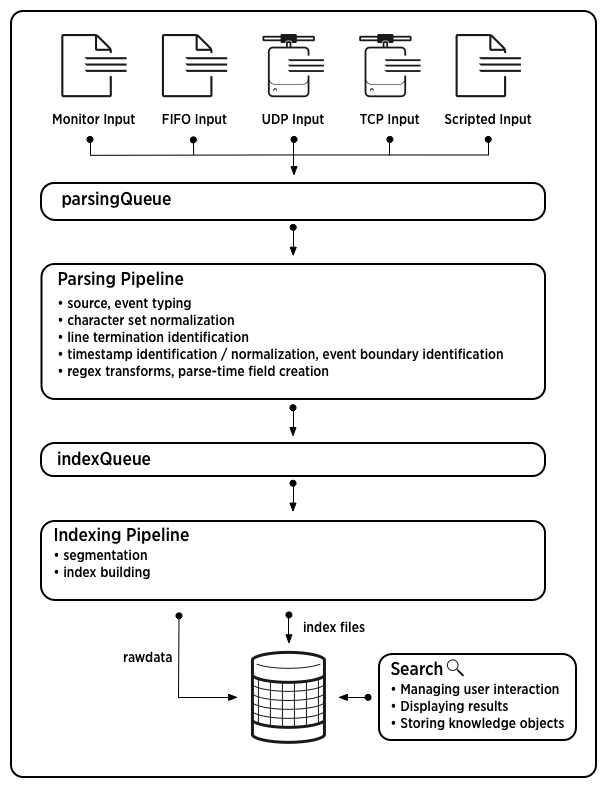
This diagram shows the main steps in the data pipeline. In the data input tier, consumes data from various inputs. Then, in the indexing tier, examines, analyzes, and transforms the data. then takes the parsed events and writes them to the index on disk. Finally, the search management tier manages all aspects of how the user accesses, views, and uses the indexed data.
Event processing
Event processing occurs in two stages, parsing and indexing. All data enters through the parsing pipeline as large chunks. During parsing, the Splunk platform breaks these chunks into events. It then hands off the events to the indexing pipeline, where final processing occurs.
During both parsing and indexing, the Splunk platform transforms the data. You can configure most of these processes to adapt them to your needs.
In the parsing pipeline, the Splunk platform performs a number of actions. The following table shows some examples in addition to related information:
| Action | Related information |
|---|---|
Extracting a set of default fields for each event, including host, source, and sourcetype.
|
About default fields |
| Configuring character set encoding. | Configure character set encoding |
| Identifying line termination using line breaking rules. You can also modify line termination settings interactively, using the Set Source Type page in Splunk Web. | Configure event line breaking Assign the correct source types to your data |
| Identifying or creating timestamps. At the same time that it processes timestamps, Splunk software identifies event boundaries. You can modify timestamp settings interactively, using the Set Source Type page in Splunk Web. | How timestamp assignment works Assign the correct source types to your data |
| Anonymizing data, based on your configuration. You can mask sensitive data (such as credit card or social security numbers) at this stage. | Anonymize data |
| Applying custom metadata to incoming events, based on your configuration. | Assign default fields dynamically |
In the indexing pipeline, the Splunk platform performs additional processing. For example:
- Breaking all events into segments that can then be searched. You can determine the level of segmentation, which affects indexing and searching speed, search capability, and efficiency of disk compression. See About event segmentation.
- Building the index data structures.
- Writing the raw data and index files to disk, where post-indexing compression occurs.
The distinction between parsing and indexing pipelines matters mainly for forwarders. Heavy forwarders can parse data locally and then forward the parsed data on to receiving indexers, where the final indexing occurs. Universal forwarders offer minimal parsing in specific cases such as handling structured data files. Additional parsing occurs on the receiving indexer.
For information about events and what happens to them during the indexing process, see Overview of event processing.
Enhance and refine events with knowledge objects
After the data has been transformed into events, you can make the events more useful by associating them with knowledge objects, such as event types, field extractions, and reports. For information about managing Splunk software knowledge, see the Knowledge Manager Manual, starting with What is Splunk knowledge?.
| Other ways to get data in | How do you want to add data? |
This documentation applies to the following versions of Splunk® Enterprise: 7.0.0, 7.0.1, 7.0.2, 7.0.3, 7.0.4, 7.0.5, 7.0.6, 7.0.7, 7.0.8, 7.0.9, 7.0.10, 7.0.11, 7.0.13, 7.1.0, 7.1.1, 7.1.2, 7.1.3, 7.1.4, 7.1.5, 7.1.6, 7.1.7, 7.1.8, 7.1.9, 7.1.10, 7.2.0, 7.2.1, 7.2.2, 7.2.3, 7.2.4, 7.2.5, 7.2.6, 7.2.7, 7.2.8, 7.2.9, 7.2.10, 7.3.0, 7.3.1, 7.3.2, 7.3.3, 7.3.4, 7.3.5, 7.3.6, 7.3.7, 7.3.8, 7.3.9, 8.0.0, 8.0.1, 8.0.2, 8.0.3, 8.0.4, 8.0.5, 8.0.6, 8.0.7, 8.0.8, 8.0.9, 8.0.10, 8.1.0, 8.1.1, 8.1.2, 8.1.3, 8.1.4, 8.1.5, 8.1.6, 8.1.7, 8.1.8, 8.1.9, 8.1.10, 8.1.11, 8.1.12, 8.1.13, 8.1.14, 8.2.0, 8.2.1, 8.2.2, 8.2.3, 8.2.4, 8.2.5, 8.2.6, 8.2.7, 8.2.8, 8.2.9, 8.2.10, 8.2.11, 8.2.12, 9.0.0, 9.0.1, 9.0.2, 9.0.3, 9.0.4, 9.0.5, 9.0.6, 9.0.7, 9.0.8, 9.0.9, 9.0.10, 9.1.0, 9.1.1, 9.1.2, 9.1.3, 9.1.4, 9.1.5, 9.1.6, 9.1.7, 9.1.8, 9.2.0, 9.2.1, 9.2.2, 9.2.3, 9.2.4, 9.2.5, 9.3.0, 9.3.1, 9.3.2, 9.3.3, 9.4.0, 9.4.1

 Download manual
Feedback submitted, thanks!