Event annotations for charts
Event annotations allow you to add context to the trends returned by your time charts. For example, if you have a chart that shows website login errors over the last week, you can add an event annotation that flags the times when your servers were down over that period. If the majority of the login errors occurred when your servers were down, you can conclude that the two events are related. Using event annotations in this way gives you the ability to correlate discrete data sets.
Event annotations are presented as colored flags that display time stamp information and custom descriptions in labels when you hover your cursor over them.
Event annotations are supported only for line charts, column charts, and area charts.
If you set an Auto refresh delay in the Edit Search panel, you must manually add the same refresh time in the XML for the event annotation search. For example, if you've set the delay in the UI, it will look similar to this 30 second delay code in the Source tab of the panel for your primary search:
<refresh>30s</refresh>
<refreshType>delay</refreshType>
To ensure that the event annotations also refresh on the same schedule, add the same lines to the secondary search that runs the event annotations.
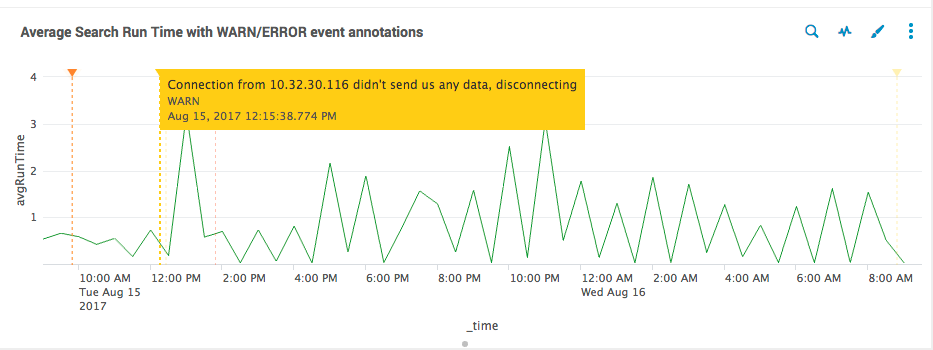
The following image is an example of a dashboard panel that includes event annotations. The panel shows a chart depicting average search run times overlaid with event annotations taken from a secondary search of internal logs with "WARN" and "ERROR" notifications. The yellow label shows the custom message for the event annotation for "WARN."
Creating event annotations
You create event annotations from the dashboard editor using Simple XML. Event annotation searches are sourced from the data in logs and lookups or from a data source that you have manually added. If you are not familiar with using Simple XML to edit dashboards, see Editing Simple XML.
To add an event annotation to a chart, use the command search type= "annotation" followed by the query that searches the data for the events to annotate, and the time frame for the query. For example, the following is the Simple XML for the dashboard panel above.
<dashboard version="1.1">
  <label>Search Analysis</label>
  <description>Search metrics correlated with user activity and log events</description>
  <row>
    <panel>
       <title>Average Search Run Time with WARN/ERROR event annotations</title>
      <chart>
        <search>
          <query>index=_audit action=search result_count="*" | timechart avg(total_run_time) as avgRunTime</query>
          <earliest>-24h@h</earliest>
          <latest>now</latest>
        </search>

        <!-- Secondary search that drives the annotations -->
        <search type="annotation">
          <query>index=_internal (log_level="WARN" OR log_level="ERROR")
| eval annotation_label = message
| eval annotation_category = log_level</query>
          <earliest>-24h@h</earliest>
          <latest>now</latest>
        </search>

        <!-- Customize the event annotation colors based on category name -->
        <option name="charting.annotation.categoryColors">{"ERROR":"#ff3300","WARN":"#ffcc00"}</option>

        <option name="charting.chart">line</option>
        <option name="charting.drilldown">none</option>
        <option name="charting.legend.placement">none</option>
        <option name="charting.lineWidth">1</option>
        <option name="charting.seriesColors">[#339933]</option>
        <option name="height">287</option>
      </chart>
    </panel>
  </row>
</dashboard>
Annotation search fields
Use the following fields to define your event annotation search.
| Field name | Type | Required | Description |
|---|---|---|---|
| _time | epoch time | Yes | The timestamp of the event. |
| annotation_label | string | No | The message that is displayed in the annotation label. |
| annotation_category | string | No | Use this field to group annotation events by type. |
| annotation_color | string | No | Use this field to assign a color to an annotation event. Colors must be specified using hex codes, for example <option name="charting.annotation.categoryColors">{"ERROR":"#ff3300","WARN":"#ffcc00"}</option>.
|
For more details about this property, see charting.annotation.categoryColors in the Chart Configuration Reference.
| Bubble chart | Chart display issues |
This documentation applies to the following versions of Splunk® Enterprise: 9.0.0, 9.0.1, 9.0.2, 9.0.3, 9.0.4, 9.0.5, 9.0.6, 9.0.7, 9.0.8, 9.0.9, 9.0.10, 9.1.0, 9.1.1, 9.1.2, 9.1.3, 9.1.4, 9.1.5, 9.1.6, 9.1.7, 9.1.8, 9.1.9, 9.2.0, 9.2.1, 9.2.2, 9.2.3, 9.2.4, 9.2.5, 9.2.6, 9.3.0, 9.3.1, 9.3.2, 9.3.3, 9.3.4, 9.4.0, 9.4.1, 9.4.2

 Download manual
Feedback submitted, thanks!