Indexing: Inputs: Data Quality
This topic is a reference for the Data Quality dashboard in the Monitoring Console. See About the Monitoring Console.
What does this dashboard show?
The Data Quality dashboard reports issues related to event processing, such as:
- automatic source typing
- line breaking
- time stamp extraction
- time zone detection
- line merging
- excessively large events (high line count and/or large event size,
len(_raw)) - indexing latency (
_indextime - _time) - metric data collection
- conversion of log events to metric data
The Data Quality dashboard includes the following panels:
Event processing issues by source type
The Event processing issues by source type panel shows a count of the number of event processing issues that have occurred by source type on the specified indexers over the selected time range. Click on any number in the table to view search results that provide more information about the specific issue. Click on the name of a source type to view issues that apply to that source type by host and source.
Issues for source type by host and source
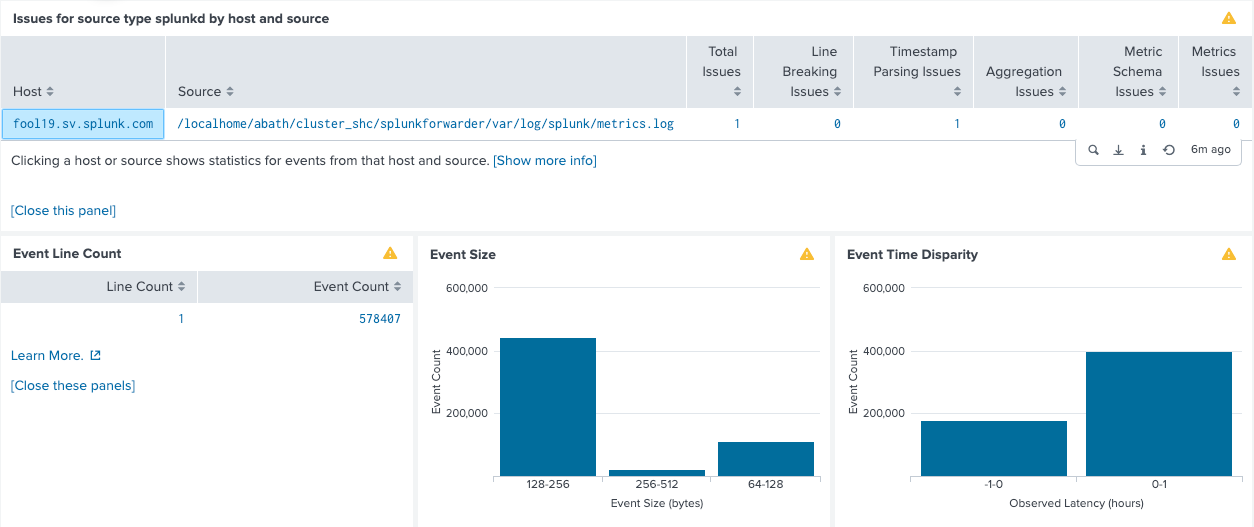
The Issues for source type by host and source panel shows a count of the number of event processing issues by host and source. This panel is useful for identifying the origin of a specific issue. Click on the name of a host or source to view additional statistics for events from that host and source, including Event Line Count, Event Size, and Event Time Disparity.
Interpret results in this dashboard
For information on how to interpret and resolve event processing issues that this dashboard indicates, see the following topics:
- Resolve data quality issues in Getting Data In.
- Get Started with Metrics and Convert event logs to metric data points in Metrics.
Troubleshoot this dashboard
This dashboard uses data from splunkd.log.
If drilldown search results are loading slowly, you might have a larger number of issues than the system can reasonably handle. Try narrowing the time range at the top of the page.
| Indexing: Inputs: HTTP Event Collector | Indexing: License Usage |
This documentation applies to the following versions of Splunk® Enterprise: 8.1.0, 8.1.1, 8.1.2, 8.1.3, 8.1.4, 8.1.5, 8.1.6, 8.1.7, 8.1.8, 8.1.9, 8.1.10, 8.1.11, 8.1.12, 8.1.13, 8.1.14, 8.2.0, 8.2.1, 8.2.2, 8.2.3, 8.2.4, 8.2.5, 8.2.6, 8.2.7, 8.2.8, 8.2.9, 8.2.10, 8.2.11, 8.2.12, 9.0.0, 9.0.1, 9.0.2, 9.0.3, 9.0.4, 9.0.5, 9.0.6, 9.0.7, 9.0.8, 9.0.9, 9.0.10, 9.1.0, 9.1.1, 9.1.2, 9.1.3, 9.1.4, 9.1.5, 9.1.6, 9.1.7, 9.1.8, 9.1.9, 9.2.0, 9.2.1, 9.2.2, 9.2.3, 9.2.4, 9.2.5, 9.2.6, 9.3.0, 9.3.1, 9.3.2, 9.3.3, 9.3.4, 9.4.0, 9.4.1, 9.4.2


 Download manual
Feedback submitted, thanks!