Configure the splunkd health report
The splunkd health report displays the status of a pre-defined set of Splunk Enterprise features. You can modify some health report settings, including feature thresholds, using the health report manager page in Splunk Web, or by editing health.conf.
For more information on health report configuration settings in health.conf, see health.conf.spec in the Admin Manual.
Supported features
The splunkd health report lets you monitor these Splunk Enterprise features:
| Feature Category | Features |
|---|---|
| Data Forwarding | Auto Load Balanced TCP Output, Ingest Actions Output |
| File Monitor Input | BatchReader, TailReader, Ingestion Latency, Forwarder Ingestion Latency |
| HEC Health | HEC Health Status |
| Index Processor | Buckets, Disk Space, Bucket Optimization, Smart Storage |
| Indexer Clustering | Cluster Bundles, Data Durability, Data Searchable, Indexers, Indexing Ready, Master Connectivity, Replication Failures, Slave State, Slave Version, Search Head Connectivity |
| Resource Usage | IOWait |
| Search Head Clustering | Member to Captain Connection, Captain Common Baseline, Captain Election Overview, Members Overview, Snapshot Creation, Shc Csv Lookup Replication |
| Search Scheduler | Searches Skipped, Searches Delayed, Search Lag |
| Workload Management | Admission Rules Check, Configuration Check, System Check |
The IOWait feature is enabled in only these cases:
- The platform is Linux
- IOWait introspection is enabled in the default server.conf
For detailed information on supported health report features, see $SPLUNK_HOME/etc/system/default/health.conf.
Set feature indicator thresholds
Each feature in the health status tree has one or more indicators. Each indicator reports a value against a pre-set threshold, which determines the status of the feature. When the indicator value meets the threshold condition, the health status of the feature changes, for example, from green to yellow, or yellow to red.
There are two valid thresholds for each indicator: yellow and red. You can modify threshold values for any feature indicator using Splunk Web or the health.conf file. Changing threshold values for any feature applies to all associated search heads or search head captains.
If distributed health reporting is enabled on your deployment, changing a feature threshold on that instance will not be reflected in the health report presented by that single instance. To disable distributed health reporting, see Disable the distributed health report.
Set thresholds using Splunk Web
To set feature threshold values in Splunk Web:
- Log in to Splunk Web on the instance you are monitoring.
- Click Settings > Health report manager.
- Find the feature you want to modify and click Edit Thresholds.
The Edit Threshold modal opens showing a detailed description of each feature indicator. - Set new indicator threshold values. For example, to modify thresholds for the Search Scheduler: Searches Skipped feature, you can set new Red or Yellow threshold values for the
percent_searches_skipped_high_priority_last_24handpercent_searches_skipped_non_high_priority_last_24hindicators:
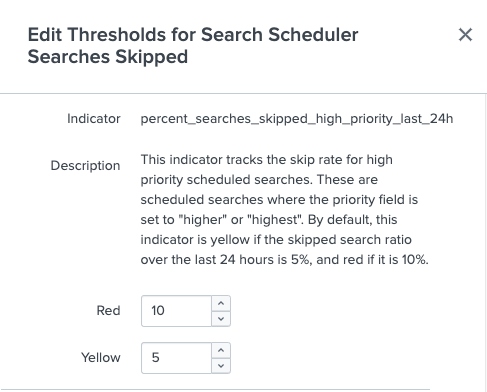
- Click Save.

To view and edit threshold settings on the health report manager page, your role must be assigned list_health and edit_health capabilities. For more information, see Set access controls for the splunkd health report.
Set thresholds using health.conf
To set feature threshold values in health.conf:
- Log in to the instance you are monitoring.
- Edit
$SPLUNK_HOME/etc/system/local/health.conf - In the feature stanza, set new indicator threshold values. For example, to modify indicator threshold values for the
batchreaderfeature, set new values fordata_out_rate:yellowanddata_out_rate:redthresholds in the following stanza:[feature:batchreader] indicator:data_out_rate:red = 10 indicator:data_out_rate:yellow = 5
Indicator thresholds are pre-set to values that apply to most use cases. When you modify threshold values, make changes in small increments. Setting threshold values too high can mask serious problems or failures.
For detailed descriptions of each feature indicator, see $SPLUNK_HOME/etc/system/default/health.conf.
Reset feature thresholds using Splunk Web
In some cases, as you modify feature thresholds, those thresholds can become noisy or out of tune with your monitoring needs. For this reason, the health report lets you track changes to threshold setting values and quickly reset feature thresholds to their default values.
To reset feature threshold values in Splunk Web:
- In Splunk web, select Settings > Health report manager.
- Find the feature you want to modify and click Edit Thresholds.
- In the modal, find the feature indicator you want to reset and select Reset to default.
The feature indicator threshold returns to its default value. - Select Save.
Disable a health report feature
You can disable any feature in the local or distributed health report using Splunk Web, the REST API, or by editing health.conf directly. Disabling a feature stops the feature from reporting health status information to the splunkd health status tree, which can be useful for removing noisy or irrelevant features from the health report view. All supported features are enabled by default in health.conf.
If distributed health reporting is enabled on your deployment, disabling a feature locally on that instance will not be reflected in the health report presented by that single instance. To disable distributed health reporting, see Disable the distributed health report.
Disable a feature using Splunk Web
To disable a feature in the local health report using Splunk Web:
- Log in to the local instance on which you want to disable the feature.
- In Splunk Web, select Settings > Health report manager.
- Find the feature you want to disable and select Edit.
- In the modal, set the Include in local report switch to Enabled or Disabled.
The feature is disabled and no longer impacts the overall health status ofsplunkd. The feature now appears greyed out in the local health report.
To disable a feature in the the distributed health report using Splunk Web:
- Log in to the central instance of the distributed health report, such as the cluster manager, search head, or search head cluster.
- In Splunk Web, select Settings > Health report manager.
- Find the feature you want to disable, and select Edit.
- In the modal, set the Include in distributed report switch to Enabled or Disabled.
The feature is disabled and no longer impacts the overall health status ofsplunkd. The feature now appears greyed out in the distributed health report.
To temporarily disable alerts for a feature, click Snooze and specify a time duration. At the end of the specified duration alerts for the feature are re-enabled.
Disable a feature in health.conf
To disable a feature in the local health report by editing health.conf:
- On the local instance, edit
$SPLUNK_HOME/etc/system/local/health.conf. - In the specific feature stanza, add
disabled = 1. For example, to disable the Data Durability feature:[feature:data_durability] indicator:cluster_replication_factor:red = 1 indicator:cluster_search_factor:red = 1 disabled = 1
To enable a feature in the local health report, set
disabled = 0 - Reload
health.conf:curl -k -u admin:pass https://<host>:<mPort>/services/configs/conf-health.conf/_reload
To disable a feature in the distributed health report by editing health.conf:
- On a central instance, such as a cluster manager, search head, or search head cluster captain, edit
$SPLUNK_HOME/etc/system/local/health.conf. - In the specific feature stanza, set
distributed_disabledto a value of true/1. For example, to disable the Disk Space feature:[feature:disk_space] indicator:cluster_replication_factor:red = 1 indicator:cluster_search_factor:red = 1 disabled = 0 distributed_disabled = 1
Disable a feature using the REST API
To disable a feature in the local health report using the REST API:
- On the local instance, send an HTTP POST request to the
server/health-config/{feature_name}endpoint, specifyingdisabled=1in the request. For example, to disable thebatchreaderfeature:curl -k -u admin:pass \ https://<host>:<mPort>/services/server/health-config/feature:batchreader -d disabled=1
- Validate the feature no longer appears in the local health report in Splunk Web.
To disable a feature in the distributed health report using the REST API:
- On the central instance, such as a cluster manager, search head, or search head cluster, send an HTTP POST request to the
server/health-config/{feature_name}endpoint, specifyingdistributed_disabled=1in the request. For example:curl -k -u admin:pass \ https://<host>:<mPort>/services/server/health-config/feature:batchreader -d distributed_disabled=1
- Validate the feature no longer appears in the distributed health report in Splunk Web.
For endpoint details, see server/health-config/{feature_name} in the REST API Reference Manual.
To access server/health-config/ endpoints, your role must have the edit_health capability.
Disable the distributed health report
The distributed health report is enabled by default (set to disabled = 0) in health.conf. If for any reason you need to disable the distributed health report, you can do so as follows:
- Log in to the instance on which you monitor your deployment.
- Edit
$SPLUNK_HOME/etc/system/local/health.conf. - In the
[distributed_health_reporter]stanza, setdisabled = 1. For example:[distributed_health_reporter] disabled = 1
Suppress health status updates
Features in the health status tree update their status at predetermined intervals. A feature whose health status changes frequently can cause excessive undesirable changes to the overall status of the splunkd health report. To prevent this, use the suppress_status_update_ms attribute in health.conf to reduce the frequency with which a particular feature can update its health status.
Use the suppress_health_status_update_ms attribute to:
- Limit excessive changes to the internal state by individual features.
- Reduce the number of log entries that arise from rapid feature status changes.
- Help quiet "noisy" features.
For example, an indexer clustering feature, such as data_durability, can experience frequent status changes during operations that impact its indicators: cluster_replication_factor and cluster_search_factor. To avoid frequent changes to the overall splunkd health report, you might set suppress_status_update_ms = 60000 to reduce health status updates to once every minute.
To suppress health status updates:
- Log in to the instance you are monitoring.
- Edit
$SPLUNK_HOME/etc/system/local/health.conf - In the appropriate feature stanza, add the
suppress_status_update_msattribute. For example:[feature:data_durability] indicator:cluster_replication_factor:red = 1 indicator:cluster_search_factor:red = 1 suppress_status_update_ms = 60000
By default, the minimum amount of time that must elapse between status updates is 300ms.
For more information, see health.conf.spec in the Admin Manual.
Configure health status logs
Each feature in the splunkd health status tree generates log entries in health.log. These log entries record information about feature indicator status changes over time. health.log is located in SPLUNK_HOME/var/log/splunk/.
There are two types of health.log log entries:
HealthChangeReporter: This log entry records specific health status changes for a feature indicator. Each entry includes a timestamp, feature name, indicator name, previous color, new color, and a possible reason for the status change. This log entry appears only if a feature's status changes, for example, from green to red:
02-28-2018 20:26:52.775 +0000 INFO HealthChangeReporter - feature="Data Durability" indicator="cluster_replication_factor" previous_color=green color=red reason="Replication Factor is not met"
PeriodicHealthReporter: This log entry keeps an ongoing record of the status of each feature in the health status tree. Each entry includes a timestamp, the feature name, and current color. Log entries are made at a user-configurable interval. For example:
02-28-2018 20:27:06.826 +0000 INFO PeriodicHealthReporter - feature="Data Durability" color=red
Set health.log entry intervals
You can set the interval at which PeriodicHealthReporter log entries are added to health.log. This is useful if you want to increase or decrease the overall number of log entries that appear in health.log.
To adjust the frequency of PeriodicHealthReporter log entries in health.log:
- Log in to the instance you are monitoring.
- Edit $SPLUNK_HOME/etc/system/local/health.conf
- In the [health_reporter] stanza, set the
full_health_log_intervalattribute to an appropriate value in seconds. For example:[health_reporter] full_health_log_interval = 60
By default, each feature generates a
PeriodicHealthReporterlog entry every 30 seconds.
| Requirements | Set up alerts for the splunkd health report |
This documentation applies to the following versions of Splunk® Enterprise: 9.4.0, 9.4.1, 9.4.2
Feedback submitted, thanks!