************************************************************************
Splunk Enterprise versions higher than version 9.4.2 are documented only on our new documentation portal.
************************************************************************
To get started, see the Splunk Enterprise page on help.splunk.com and the Splunk Enterprise 9.4.3 release notes.
************************************************************************
For information about how version selection works in the new portal, see Version selection on the About This Site page.
************************************************************************
Part 7: Add an input
Buttercup Games sells many different games, and on the dashboard, it's difficult to scan through all the games to find the one you're looking for. In this part of the tutorial, add a dropdown menu input to your dashboard to filter the visualizations by any game you choose. After you add an input, you must define the input token name and apply the token to data sources powering the visualizations you want to filter.
- Select the add input icon (
 ) in the editing toolbar, and then select Dropdown.
 - In the Configuration panel, change Display from Above canvas to In canvas.
- Position the Dropdown to fit in the top left rectangle.
- In the Configuration panel, give your input the following title and token name.
- Title: Select Game Category
- Token name: category
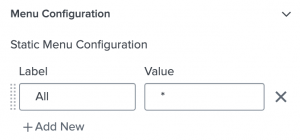
- In the Menu configuration section, remove the Item 1 and Item 2 rows (
 ) so that there is only one value in the table:
- In the Data sources section, select + Set up Primary Data Source.
- Select + Create Search and name it Games Categories.
- Add your search. For this tutorial, copy and paste the following search into the SPL Query field:
This query aggregates all purchases based on the category of game that each purchase belongs to.
index=main sourcetype=access_* action=purchase status=200
| stats count by categoryId
- Select Apply & Close.
- In the Menu configuration section of the Configuration panel, select categoryId (string) in the Dynamic Menu Label Field dropdown menu as well as in the Dynamic Menu Value Field dropdown menu.
- In the Color and style section of the Configuration panel, change the Background to transparent.
- Select the Total Revenue visualization on your dashboard, and then select the edit icon (
 ) next to the Total Revenue data source.
 - Add your input token to the search by copying and pasting the following SPL before
| stats sum(Revenue)| search Category=$category$
This SPL sets the category used in all the visualizations as the category you select in the input dropdown. You can interact with the visualizations powered by a data source after adding your newly defined token to that data source. After editing the Total Revenue data source, its SPL looks like this:
| search Category=$category$ | stats sum(Revenue)
- Select Apply & Close.
- Next, select the map visualization, and then select the edit icon () next to the Purchase Locations data source.
- Add your input token to the search by copying and pasting the following SPL after
status=200categoryId="$category$"
This SPL sets the category used in all the visualizations as the category you select in the input dropdown. After editing the Total Revenue data source, its SPL looks like this:
index=main sourcetype=access_* action=purchase status=200 categoryId="$category$" productName="*"
| iplocation clientip
| lookup geo_countries latitude AS lat longitude AS lon OUTPUT featureId AS country
| stats count by country
| geom geo_countries featureIdField=country
- Select Apply & Close.
- To test your input, select a category in the dropdown menu and watch the single value visualization and map display data reflecting your selection.
- Reset the dropdown menu to All.

After completing Part 7, your chart looks similar to this:

Next step
You've completed Part 7 of the Splunk Dashboard Studio tutorial and you can filter what values appear in visualizations using the dropdown input. Next, finish up your dashboard by saving and exporting the final product. Continue to Part 8: Save and export the dashboard.
| Part 6: Add a map | Part 8: Save and export the dashboard |
This documentation applies to the following versions of Splunk® Enterprise: 9.1.2, 9.1.3, 9.1.4, 9.1.5, 9.1.6, 9.1.7, 9.1.8, 9.1.9, 9.2.0, 9.2.1, 9.2.2, 9.2.3, 9.2.4, 9.2.5, 9.2.6, 9.3.0, 9.3.1, 9.3.2, 9.3.3, 9.3.4, 9.4.0, 9.4.1, 9.4.2
Feedback submitted, thanks!