************************************************************************
Splunk Enterprise versions higher than version 9.4.2 are documented only on our new documentation portal.
************************************************************************
To get started, see the Splunk Enterprise page on help.splunk.com and the Splunk Enterprise 9.4.3 release notes.
************************************************************************
For information about how version selection works in the new portal, see Version selection on the About This Site page.
************************************************************************
Time range
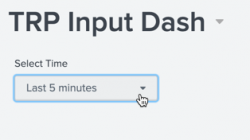
Adding a time range picker input allows users to choose time intervals to create tokens to use in searches.
The following options are available to use in the options field:
- defaultValue
- token
The following is an example of input.timerange:
Expand this window to copy/paste the dashboard definition into your own dashboard.
{
    "visualizations": {},
    "dataSources": {
        "ds_search1": {
            "type": "ds.search",
            "options": {
                "query": "index=_internal \n| stats count by user",
                "queryParameters": {
                    "latest": "$trp.latest$",
                    "earliest": "$trp.earliest$"
                }
            },
            "name": "User"
        }
    },
    "inputs": {
        "input_1": {
            "type": "input.timerange",
            "title": "Select Time",
            "options": {
                "defaultValue": "-5m, now",
                "token": "trp"
            }
        }
    },
    "layout": {
        "tabs": {
            "items": [
                {
                    "layoutId": "layout_1",
                    "label": "New tab"
                }
            ]
        },
        "layoutDefinitions": {
            "layout_1": {
                "type": "absolute",
                "structure": []
            }
        },
        "globalInputs": [
            "input_1"
        ]
    },
    "description": "",
    "title": "TRP Input Dash"
}
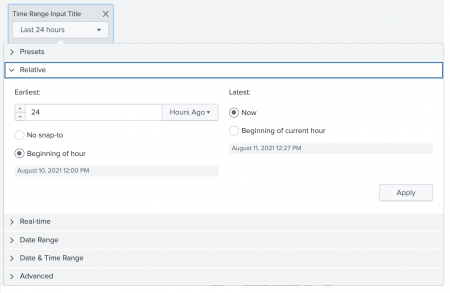
The global time range picker
The global time range picker is unique from other time range pickers because it is included in all new dashboards by default and can control all searches of type ds.search. Global time range picker controls all searches by adding settings in the defaults section of the dashboard definition.
To see an example of a complete dashboard with the global time range picker and its defaults values, you can expand the following dashboard definition:
Expand this window to copy/paste the dashboard definition into your own dashboard.
{
    "visualizations": {
        "viz_ZgRiQCoQ": {
            "type": "splunk.column",
            "options": {},
            "dataSources": {
                "primary": "ds_GHdtwfg5"
            }
        }
    },
    "dataSources": {
        "ds_GHdtwfg5": {
            "type": "ds.search",
            "options": {
                "query": "index=_internal \n|  top 100 sourcetype"
            },
            "name": "Search_1"
        }
    },
    "defaults": {
        "dataSources": {
            "global": {
                "options": {
                    "queryParameters": {
                        "latest": "$global_time.latest$",
                        "earliest": "$global_time.earliest$"
                    }
                }
            }
        },
        "visualizations": {
            "global": {
                "showLastUpdated": true
            }
        }
    },
    "inputs": {
        "input_global_trp": {
            "type": "input.timerange",
            "options": {
                "token": "global_time",
                "defaultValue": "-24h@h,now"
            },
            "title": "Global Time Range"
        }
    },
    "layout": {
        "tabs": {
            "items": [
                {
                    "layoutId": "layout_1",
                    "label": "New tab"
                }
            ]
        },
        "layoutDefinitions": {
            "layout_1": {
                "type": "absolute",
                "structure": [
                    {
                        "item": "viz_ZgRiQCoQ",
                        "type": "block",
                        "position": {
                            "x": 0,
                            "y": 0,
                            "w": 300,
                            "h": 300
                        }
                    }
                ]
            }
        },
        "globalInputs": [
            "input_global_trp"
        ]
    },
    "title": "Global time range picker",
    "description": ""
}
To learn more about using dashboard defaults, see Set global and local defaults.
If you want to use different time ranges for various data sources, you can modify or delete the default input, or create your own.
The following screenshot shows the global time range picker.
Delete the global time range picker
You can both delete and edit this input. To delete the input, do the following:
- In the visual editor, click the
Xin the corner of the input. This will remove the input from the visual editor, the dashboard definition, and the layout. - Manually delete the time range tokens in the defaults section using the source editor.
DeletequeryParametersand the related settings.
"defaults": {
	"dataSources": {
		"global": {
			"options": {
				"queryParameters": {
					"latest": "$global_time.latest$",
					"earliest": "$global_time.earliest$"
				}
			}
		}
	},
If you delete the input entirely in the source editor, remember to remove it from the globalInputs section of the layout, the queryParameters, and the related settings in the defaults section.
| Number field | Adding and configuring inputs |
This documentation applies to the following versions of Splunk® Enterprise: 9.4.0, 9.4.1, 9.4.2


 Download manual
Feedback submitted, thanks!