Use inputs to make dashboards dynamic
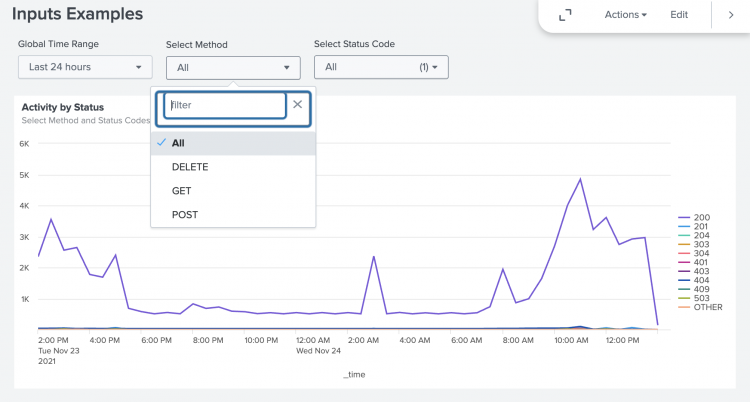
Use inputs to let dashboard users interact with dashboard data and visualizations using the dropdown and multiselect menus, time range pickers, and more. The following is an example of a dashboard that uses many inputs.
Expand this window to copy/paste the dashboard definition for this example into your own dashboard.
{
    "visualizations": {
        "viz_1BAm6ljX": {
            "type": "splunk.line",
            "dataSources": {
                "primary": "ds_6v2nFTBZ"
            },
            "showProgressBar": false,
            "showLastUpdated": false,
            "title": "Activity by Status",
            "description": "Select Method and Status Codes"
        }
    },
    "dataSources": {
        "ds_ljNWYr7J": {
            "type": "ds.search",
            "options": {
                "query": "index=_internal \n|  stats count by method"
            },
            "name": "Method"
        },
        "ds_neN4LNL4": {
            "type": "ds.search",
            "options": {
                "query": "index=_internal \n| stats count by status"
            },
            "name": "Status"
        },
        "ds_6v2nFTBZ": {
            "type": "ds.search",
            "options": {
                "query": "index=_internal method=\"$method$\" \n| search status IN ($status$)\n| timechart count by status"
            },
            "name": "Status codes per method"
        }
    },
    "defaults": {
        "dataSources": {
            "ds.search": {
                "options": {
                    "queryParameters": {
                        "latest": "$global_time.latest$",
                        "earliest": "$global_time.earliest$"
                    }
                }
            }
        }
    },
    "inputs": {
        "input_global_trp": {
            "type": "input.timerange",
            "options": {
                "token": "global_time",
                "defaultValue": "-24h@h,now"
            },
            "title": "Global Time Range"
        },
        "input_08lrAW9u": {
            "options": {
                "items": ">frame(label, value) | prepend(formattedStatics) | objects()",
                "defaultValue": "*",
                "token": "method"
            },
            "title": "Select Method",
            "type": "input.dropdown",
            "dataSources": {
                "primary": "ds_ljNWYr7J"
            },
            "context": {
                "formattedConfig": {
                    "number": {
                        "prefix": ""
                    }
                },
                "formattedStatics": ">statics | formatByType(formattedConfig)",
                "statics": [
                    [
                        "All"
                    ],
                    [
                        "*"
                    ]
                ],
                "label": ">primary | seriesByName(\"method\") | renameSeries(\"label\") | formatByType(formattedConfig)",
                "value": ">primary | seriesByName(\"method\") | renameSeries(\"value\") | formatByType(formattedConfig)"
            }
        },
        "input_RhQr1bEx": {
            "options": {
                "items": ">frame(label, value) | prepend(formattedStatics) | objects()",
                "defaultValue": "*",
                "token": "status"
            },
            "title": "Select Status Code",
            "type": "input.multiselect",
            "dataSources": {
                "primary": "ds_neN4LNL4"
            },
            "context": {
                "formattedConfig": {
                    "number": {
                        "prefix": ""
                    }
                },
                "formattedStatics": ">statics | formatByType(formattedConfig)",
                "statics": [
                    [
                        "All"
                    ],
                    [
                        "*"
                    ]
                ],
                "label": ">primary | seriesByName(\"status\") | renameSeries(\"label\") | formatByType(formattedConfig)",
                "value": ">primary | seriesByName(\"status\") | renameSeries(\"value\") | formatByType(formattedConfig)"
            }
        }
    },
    "layout": {
        "tabs": {
            "items": [
                {
                    "layoutId": "layout_1",
                    "label": "New tab"
                }
            ]
        },
        "layoutDefinitions": {
            "layout_1": {
                "type": "grid",
                "structure": [
                    {
                        "item": "viz_1BAm6ljX",
                        "type": "block",
                        "position": {
                            "x": 0,
                            "y": 0,
                            "w": 1200,
                            "h": 400
                        }
                    }
                ]
            }
        },
        "globalInputs": [
            "input_global_trp",
            "input_08lrAW9u",
            "input_RhQr1bEx"
        ]
    },
    "description": "",
    "title": "Inputs Examples"
}
Inputs can be modified and formatted in both the visual editor and source editor. You must use the source editor for configurations that are not available in the visual editor. To learn how to use the source editor, see Source code editor.
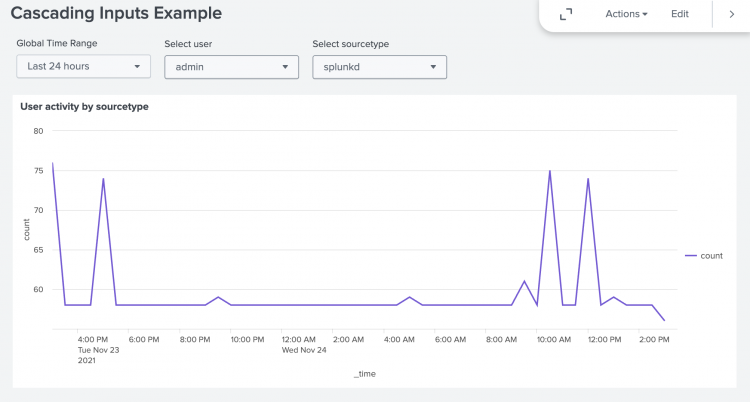
Example: Search-based cascading inputs
The following example uses most of the input features that are supported, including the following:
- A time range picker to inform all earliest and latest query parameters for each data source.
- Searches that use tokens to populate values displayed in both the dropdown and the mulitselect inputs (these searches are over a time range determined by the selected time range).
- A dropdown input that creates a token value based on a user selection. The token is then used in the query that populates the multiselect input menu.
- The input menus display the current values of the dropdown and multiselect inputs that assign token values used in visualizations.
Expand this window to copy/paste the dashboard definition into your own dashboard.
{
    "visualizations": {
        "viz_im35RPlF": {
            "type": "splunk.line",
            "dataSources": {
                "primary": "ds_XdUxasDT"
            },
            "title": "User activity by sourcetype"
        }
    },
    "dataSources": {
        "ds_eiFyjWZU": {
            "type": "ds.search",
            "options": {
                "query": "index=_internal \n|  stats count by user"
            },
            "name": "Users"
        },
        "ds_GQslD2fp": {
            "type": "ds.search",
            "options": {
                "query": "index=_internal user=$user$\n| stats count by sourcetype"
            },
            "name": "Sourcetype"
        },
        "ds_XdUxasDT": {
            "type": "ds.search",
            "options": {
                "query": "index=_internal user=$user$ sourcetype=$sourcetype$ \n| timechart count"
            },
            "name": "User activity by sourcetype"
        }
    },
    "defaults": {
        "dataSources": {
            "ds.search": {
                "options": {
                    "queryParameters": {
                        "latest": "$global_time.latest$",
                        "earliest": "$global_time.earliest$"
                    }
                }
            }
        }
    },
    "inputs": {
        "input_global_trp": {
            "type": "input.timerange",
            "options": {
                "token": "global_time",
                "defaultValue": "-24h@h,now"
            },
            "title": "Global Time Range"
        },
        "input_RtgCL23i": {
            "options": {
                "items": ">frame(label, value) | prepend(formattedStatics) | objects()",
                "token": "user"
            },
            "title": "Select user",
            "type": "input.dropdown",
            "dataSources": {
                "primary": "ds_eiFyjWZU"
            },
            "context": {
                "formattedConfig": {
                    "number": {
                        "prefix": ""
                    }
                },
                "formattedStatics": ">statics | formatByType(formattedConfig)",
                "statics": [
                    [
                        "All"
                    ],
                    [
                        "*"
                    ]
                ],
                "label": ">primary | seriesByName(\"user\") | renameSeries(\"label\") | formatByType(formattedConfig)",
                "value": ">primary | seriesByName(\"user\") | renameSeries(\"value\") | formatByType(formattedConfig)"
            }
        },
        "input_62Om37PV": {
            "options": {
                "items": ">frame(label, value) | prepend(formattedStatics) | objects()",
                "token": "sourcetype"
            },
            "title": "Select sourcetype",
            "type": "input.dropdown",
            "dataSources": {
                "primary": "ds_GQslD2fp"
            },
            "context": {
                "formattedConfig": {
                    "number": {
                        "prefix": ""
                    }
                },
                "formattedStatics": ">statics | formatByType(formattedConfig)",
                "statics": [
                    [
                        "All"
                    ],
                    [
                        "*"
                    ]
                ],
                "label": ">primary | seriesByName(\"sourcetype\") | renameSeries(\"label\") | formatByType(formattedConfig)",
                "value": ">primary | seriesByName(\"sourcetype\") | renameSeries(\"value\") | formatByType(formattedConfig)"
            }
        }
    },
    "layout": {
        "tabs": {
            "items": [
                {
                    "layoutId": "layout_1",
                    "label": "New tab"
                }
            ]
        },
        "layoutDefinitions": {
            "layout_1": {
                "type": "grid",
                "structure": [
                    {
                        "item": "viz_im35RPlF",
                        "type": "block",
                        "position": {
                            "x": 0,
                            "y": 0,
                            "w": 1200,
                            "h": 400
                        }
                    }
                ]
            }
        },
        "globalInputs": [
            "input_global_trp",
            "input_RtgCL23i",
            "input_62Om37PV"
        ]
    },
    "description": "",
    "title": "Cascading Inputs Example"
}
| Add text, links, and images with Markdown | Dropdown |
This documentation applies to the following versions of Splunk® Enterprise: 9.4.0, 9.4.1, 9.4.2


 Download manual
Feedback submitted, thanks!