About the Search app
The Search & Reporting app, referred to as the Search app, is the application that you use to search and create reports on your data.
This topic describes the views and elements that comprise the Search app.
Open the Search app
To open the Search app, from Splunk Home click Search & Reporting in the Apps panel. This opens the Search Summary view in the Search & Reporting app.
The Search summary view
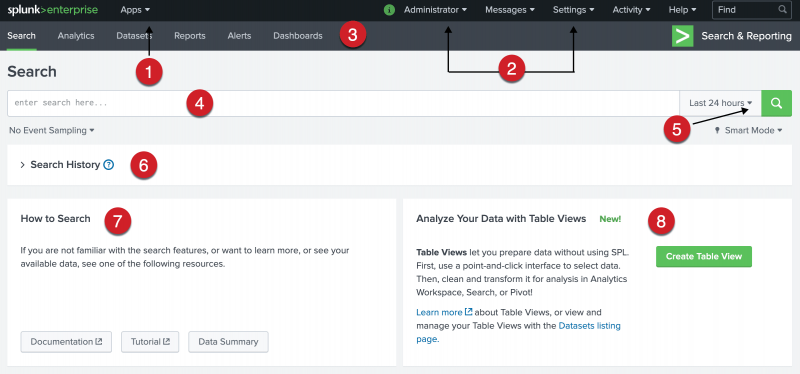
Before you run a search, the Search summary view displays the following elements: App bar, Search bar, Time range picker, How to Search panel, Search History panel, and the Analyze Your Data with Table Views panel.
Some of these are common elements that you see on other views. Elements that are unique to the Search Summary view are the panels below the Search bar.
| Number | Element | Description |
|---|---|---|
| 1 | Applications menu | Switch between Splunk applications that you have installed. The current application, Search & Reporting app, is listed. This menu is on the Splunk bar. |
| 2 | Splunk bar | Edit your Splunk configuration, view system-level messages, and get help on using the product. |
| 3 | Apps bar | Navigate between the different views in the application you are in. For the Search & Reporting app the views are: Search, Datasets, Reports, Alerts, and Dashboards. |
| 4 | Search bar | Specify your search criteria. |
| 5 | Time range picker | Specify the time period for the search, such as the last 30 minutes or yesterday. The default is Last 24 hours. |
| 6 | Search history | View a list of the searches that you have run. The search history appears after you run your first search. |
| 7 | How to Search | Use the links to learn more about how to start searching your data, as well a summary of the data that you have access to. |
| 8 | Analyze Your Data with Table Views | Create curated collections of event data into datasets that you design for a specific business purpose. |
Data summary
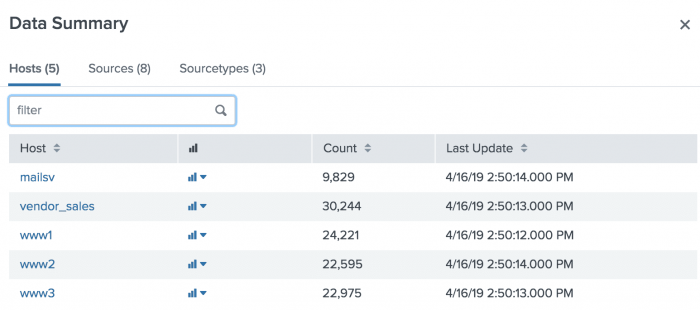
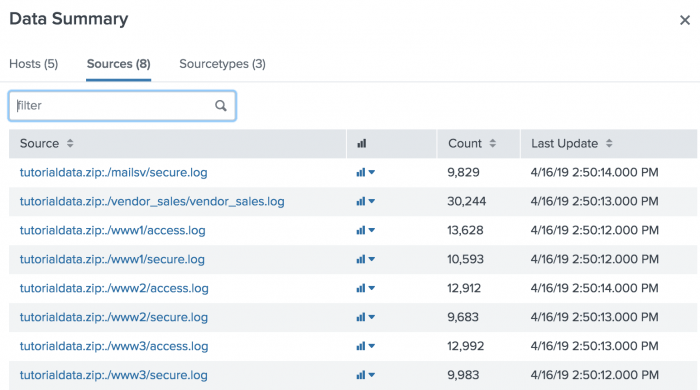
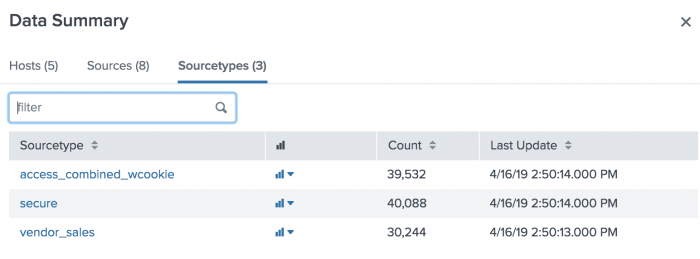
The Data Summary dialog box shows three tabs: Hosts, Sources, Sourcetypes. These tabs represent searchable fields in your data. Selecting a host, source, or source type from the Data Summary dialog box is a great way to see how your data is turned into events.
Host
The host of an event is the host name, IP address, or fully qualified domain name of the network machine from which the event originated. In a distributed environment, you can use the host field to search data from specific machines.
Source
The source of an event is the file or directory path, network port, or script from which the event originated.
Source type
The source type of an event tells you what kind of data it is, usually based on how the data is formatted. This classification lets you search for the same type of data across multiple sources and hosts.
In this example, source types are:
- access_combined_wcookie: Apache web server logs
- secure: Secure server logs
- vendor_sales: Global sales vendors
For information about which source type is assigned to your data, see Why source types matter in the Getting Data In manual.
The New Search view
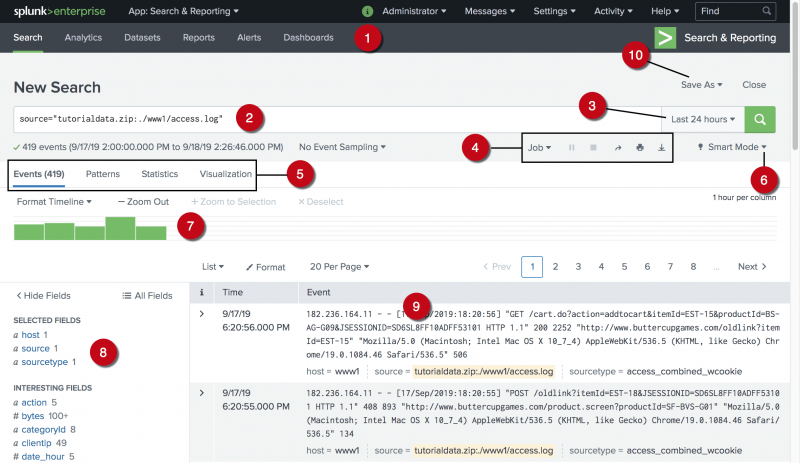
The New Search view opens after you run a search or when you click the Search tab to start a new search. The App bar, Search bar, and Time range picker are still available in this view. Additionally, this view contains many more elements: search action buttons and search mode selector; counts of events; job status bar; and tabs for Events, Patterns, Statistics, and Visualizations.
You can type index=_internal in the Search bar and press Enter to look at the events from the internal log files on your Splunk instance.
If you followed the steps
to get data into your Splunk deployment in the Search Tutorial, you can type buttercupgames in the Search bar and press Enter to search for the "buttercupgames" keyword in your events.
In this view, the App bar, Search bar and Time range picker are also available. The New Search view contains many more elements such as search action buttons, a search mode selector, counts of events, a job status bar, and results tabs for Events, Patterns, Statistics, and Visualizations.
| Number | Element | Description |
|---|---|---|
| 1 | Apps bar | Navigate between the different views in the Search & Reporting app: Search, Metrics, Datasets, Reports, Alerts, and Dashboards. |
| 2 | Search bar | Specify your search criteria. |
| 3 | Time range picker | Specify the time period for the search. |
| 4 | Search action buttons | Actions that you can perform, including working with your search Job, sharing, printing, and exporting your search results. |
| 5 | Search results tabs | The tab that your search results appear on depends on your search. Some searches produce a set of events, which appear on the Events tab. Other searches transform the data in events to produce search results, which appear on the Statistics tab. |
| 6 | Search mode menu | Use the search mode selector to provide a search experience that fits your needs. The modes are Smart (default), Fast, and Verbose. |
| 7 | Timeline | A visual representation of the number of events that occur at each point in time. Peaks or valleys in the timeline can indicate spikes in activity or server downtime. The timeline options are located above the timeline. You can format the timescale, zoom out, or zoom to a selected set of events. |
| 8 | Fields sidebar | Displays a list of the fields discovered in the events. The fields are grouped into Selected Fields and Interesting Fields. |
| 9 | Events viewer | Displays the events that match your search. By default, the most recent event is listed first. In each event, the matching search terms are highlighted. To change the event view, use the List, Format, and Per Page options. |
| 10 | Save As menu | Use the Save As menu to save your search results as a Report, Dashboard Panel, Alert, or Event Type. |
App bar
Use the App bar to navigate between the different views in the Search & Reporting app: Search, Pivot, Reports, Alerts, and Dashboards. There are entire manuals devoted to these other capabilities.
Search bar
Use the search bar to specify your search criteria in Splunk Web. Type your search string and press Enter, or click the Search icon which is on the right side of the search bar.
Time range picker
Time is the single most important search parameter that you specify.
Use the time range picker to retrieve events over a specific time period. For real-time searches you can specify a window over which to retrieve events. For historical searches, you can restrict your search by specifying a relative time range such as 15 minutes ago, Yesterday, and so on. You can also restrict your searches using a specific date and time range. The time range picker has many preset time ranges that you can select from, but you can also type a custom time range.
For more information, see About searching with time.
Timeline
The timeline is a visual representation of the number of events that occur at each point in time in your results. Peaks or valleys in the timeline can indicate spikes in activity or server downtime. The timeline options are located above the timeline. You can zoom in, zoom out, and change the scale of the chart.
When you click a point on the timeline or use on of the timeline options, the display of the timeline changes based on the events returned from your search. A new search is not run.
Use the Format Timeline drop-down list to hide or change the scale of the timeline.
Search actions
There are a wide range of search actions you can perform, including working with your search Jobs, saving, sharing, exporting, and printing your search results.
For more information, see:
Search mode
You can use the search mode selector to provide a search experience that fits your needs. The modes are Smart (default), Fast, and Verbose.
For more information, see Search modes.
Fields sidebar
To the left of the events list is the Fields sidebar. As events are retrieved that match your search, the Fields sidebar shows the Selected Fields and Interesting Fields in the events. These are the fields that the Splunk software extracts from your data.
When you first run a search the Selected Fields list contains the default fields host, source, and sourcetype. The default fields appear in every event.
Interesting Fields are fields that appear in at least 20% of the events.
Next to the field name is a count of how many distinct values there are in that field. Click on any field name to show more information about that field, such as a count and percentage of events that include each value.
If the number of distinct values in a field exceeds 100, the field summary statistics begins discarding some of the statistical information to keep memory usage low. For these fields an approximate distinct count is computed instead of an exact distinct count. This is an intended feature to conserve memory.
| Search with Splunk Web, CLI, or REST API | Anatomy of a search |
This documentation applies to the following versions of Splunk Cloud Platform™: 9.3.2411 (latest FedRAMP release), 9.0.2208, 9.0.2209, 8.2.2112, 8.2.2201, 8.2.2202, 8.2.2203, 9.0.2205, 9.0.2303, 9.0.2305, 9.1.2308, 9.1.2312, 9.2.2403, 9.2.2406, 9.3.2408
 Download manual
Feedback submitted, thanks!