Use the Indexing dashboards
Data that you send to Splunk Cloud Platform is stored in indexes. Managing your indexes and their data is important to ensuring the speed and quality of your search results and the accuracy of your data insights.
The dashboards accessed from the Cloud Monitoring Console > Indexing tab let you to administer the following indexing and related functionality in your deployment:
- Thoroughly review your indexes, including their performance, current data consumption, and remaining storage capacity, and events and indexing rate of an individual index.
- Manage the quality of your data and correct parsing errors encountered during the conversion process.
- Monitor the progress of HTTP Event Collection tokens within your deployment, if you enabled this functionality.
You can self-manage your Splunk Cloud Platform index settings. See The Indexes page in the Splunk Cloud Platform Admin Manual.
A blue progress bar might appear above a panel, indicating that the Splunk platform is still generating data. Wait for the bar to disappear before reviewing the panel.
Do not modify any Cloud Monitoring Console (CMC) dashboard. Changing any of the search criteria, formatting, or layouts may cause inaccurate results and also override the automatic update process.
Check indexing performance
The CMC Indexing Performance dashboard provides information to Splunk Cloud Platform administrators on incoming data consumption. Use this dashboard to analyze the thruput rate of your indexers and determine if the rate needs to be optimized.
Review the Indexing Performance dashboard
This dashboard contains four panels. The Time Range in the Historical Charts area controls the date range of the data displayed in the bottom three panels.
To investigate your panels, go to Cloud Monitoring Console > Indexing > Indexing Performance. Use the following table to understand the dashboard interface.
| Panel or Filter | Description |
|---|---|
| Indexing thruput | Shows the speed of the indexing rate in KB per second for all of your indexers. |
| Historical Data | This area includes the three panels shown under this section.
Set a Time Range value to refresh the data in these panels. |
| Estimated Indexing Rate | Provides a bar chart of the estimated indexing rate over time, based on KB ingested per second.
You can split by index, source, or source type, or view the total of all these inputs. |
| <variable> Queue Fill Ratio | The title of this panel is dynamic and depends on the specified Aggregation value, which can be one of the following:
After you select an Aggregation value, select a Queue value to view the latency performance of each queue in the graph. Queue options are the following:
Comparing the queues against one another shows you which queue has the lowest latency and is hindering indexing performance. Note that latency performance is also known as fill percentage over time. |
| Splunk TCP Port Closures | Shows the percentage of indexers that have closed their forwarder connection port at least once in the specified time range.
A high percentage value could indicate that the ingest pipeline is overwhelmed or misconfigured, and data is not being ingested. Contact Splunk Support to resolve this issue. |
| Indexers - Blocked Queues by Queue Type | Shows indexer queues that are blocked from processing, categorized by queue type. Indexers with many blocked queues and no restarts may indicate the following:
The Time Span field in this panel works in conjunction with the Time Range selector in the Historical Data panel. Select a Time Range value for the chart's x-axis, then select a Time Span value to group data within time increments. For example, you could set a time range of 60 minutes with a time span of 5 minutes. |
Interpret indexing performance results
When interpreting your indexing performance results, note the following:
- Regularly review your indexing performance and ensure that on average it is adequately handling the load. Though occasional spikes are normal, a consistently high load degrades performance.
- Check for these issues:
- An indexing rate lower than expected. An example of this is an indexing rate of 0 with a forwarder outgoing rate of 100.
- A TCP port closure percentage value that is high. This percentage indicates an ingestion pipeline issue and indicates that data is potentially being lost.
- Source types that are sending a larger volume than expected.
- Spikes in blocked queues at regular intervals, specific times, or both. Investigate why the queues become blocked so you can remediate the underlying issue.
Check index detail
The CMC Index Detail dashboard provides Splunk Cloud Platform administrators with a more granular view about the events in and performance of a specific index. Use this dashboard to more thoroughly investigate individual indexes.
Review the Index Detail dashboard
This dashboard shows six panels of information for a specified index.
To investigate your panels, go to Cloud Monitoring Console > Indexing > Index Detail. Use the following table to understand the dashboard interface.
To view this dashboard, you must have the indexes_edit capability.
| Panel or Filter | Description |
|---|---|
| Index | The selected index value affects all panels in this dashboard.
The indexes available to you are based on user access levels. |
| Overview | Shows the uncompressed raw data size and total bucket count of the specified index. |
| Events | Shows the total number of events in the specified index, and the timestamps of the earliest and latest events. |
| Throughput: Last 24 hours (GB) | Shows the speed of the indexing rate in KB per second for the specified index over the last 24 hours.
You can split by host, source, or source type. This value is the y-axis in the graph. If the Undefined Host value appears, see the Interpret index detail results section. |
Interpret index detail results
Use the Index Detail dashboard to monitor the flow of data into the system by index. If there is an issue that affects one or more indexes, analyzing the metadata for each affected index can help you diagnose the underlying issue.
The value Undefined Host appears in the Throughput: Last 24 Hours (GB) chart when the CMC app encounters an index configuration issue and can't correctly parse the data. This issue generally indicates that the index host name is either not configured or incorrectly configured for a forwarder. For information about configuring the host for a forwarder, see the entry for hostname or host in Forward data from files and directories to Splunk Cloud Platform.
Check the status of HTTP event collection
The CMC HTTP Event Collector dashboard provides the status of your Splunk HTTP Event Collection (HEC) functionality to Splunk Cloud Platform administrators, if you use HEC tokens to securely transmit event and application data. Use this dashboard to view summarized and detailed information about your HEC token usage and performance.
See also Set up and use HTTP Event Collector in the Splunk Cloud Platform Getting Data In manual.
Review the HTTP Event Collector dashboard
This dashboard contains a number of panels about your HEC token data.
Panels are grouped into one of three views, with a fourth view that combines the other three views so you can see all the data concurrently. You can also opt to see all your HEC token data in the results, or specify a particular token for analysis.
The Historical Data view contains two graphs with a variable in the panel title that you set with a filter option: <variable> Count and Data <variable>.
For a HEC token to display in this dashboard, it must meet either of the following conditions:
- Be enabled and have received data within the last 7 days.
- Be recently disabled but have received messages within the last 7 days, prior to being disabled.
To investigate your views, go to Cloud Monitoring Console > Indexing > HTTP Event Collector. Use the following table to understand the dashboard interface.
| View or Filter | Description |
|---|---|
| HEC Token | Specify an option to see data for all HEC tokens or one specific token.
See the information in the previous section as to valid tokens that display in this dashboard. |
| Select View | Select Usage, Current Thruput, or Historical Data to see a specific view of the data, or select All to see a combined view. |
| Usage | The HTTP Event Token Usage (Last 7 Days) panel shows a table that lists the token name, all hosts associated with the token, trend line, and count. |
| Current Thruput | The Current Thruput panel shows information on the Thruput of your requests and data, per second.
The Activity (Last 30 Minutes) graph shows the count of requests and data received (MB) over time. |
| Historical Data | Set the time range for the historical data display.
The Request Overview panel shows the event count, valid request count, and invalid request count. This panel is associated with the <variable> Count graph. The title variable depends on the selected Activity Type option. The Split by Token checkbox displays only for Events and Valid Requests options. The Data Overview panel shows the total MB received and indexed. This panel is associated with the Data <variable> graph. The title variable depends on the selected Data Type option. The Split by Token checkbox displays only for the Indexed and Valid Received options. The Errors graph shows the count of all or only specific token errors over time. Select an error type from the Reason filter. The Split by Token checkbox displays when you select one of the following error type options:
The Data received indexed panel shows the amount of data received and indexed by the HTTP event collector. The title variable depends on the selected Data Type option. The Data delay panel shows the seconds between the time that the event was seen by the thruput processor in the indexing queue, and the time when the event occurred. Select a statistic to show the max or average time difference between the current time and the perceived time of the events coming through the thruput processor. |
Interpret HTTP event collection results
When interpreting your HTTP event collection results, note the following:
- Use the Errors panel in the Historical Data view to identify HEC token processing issues that you must resolve, such as authentication failures, parser errors, and invalid requests.
- A Data Received value that is greater than the Data Indexed value indicates that Splunk couldn't process the received messages. This generally occurs because of parsing issues, such as missing timestamps. You can check these values in the Current Throughput and Historical Data views.
See also Detecting scaling problems in the Splunk Cloud Platform Getting Data In manual.
Verify data quality
The CMC Data Quality dashboard provides information to Splunk Cloud Platform administrators on issues that prevented the Splunk platform from correctly parsing your incoming data. Use this dashboard to analyze and resolve common issues that happen during the ingestion process.
Your data quality can have a great impact on both your system performance and your ability to achieve accurate results from your queries. If your data quality is degraded enough, it can slow down search performance and cause inaccurate search results. Be sure to regularly check and repair any data quality issues before they become a problem.
Generally, data quality issues fall under three main categories:
- Line breaks: When there are problems with line breaks, the ability to parse your data into the correct separate events that it uses for searching is affected.
- Timestamp parsing: When there are timestamp parsing issues, the ability to determine the correct time stamp to use for the event is affected.
- Aggregation: When there are problems with aggregation, the ability to break out fields correctly is affected.
Review the Data Quality dashboard
The tables in this dashboard list the issues Splunk Cloud Platform encountered when processing your events at both the source type and source levels. To help you better identify which of your data sources have quality issues, you can opt to exclude Splunk source types in the results.
This dashboard contains one panel with a variable in the title: Issues by source type <variable> by source.
To investigate your panels, go to Cloud Monitoring Console > Indexing > Data Quality. Use the following table to understand the dashboard interface.
| Panel or Filter | Description |
|---|---|
| Time Range | Set the time range for the data display. |
| Include Splunk Source Types | Specify whether to include or exclude Splunk source types from the results. Choose No to exclude Splunk source types and filter the results to only your source types. |
| Event Processing Issues by Source Types | The results table lists the following information:
When any cell shows a number greater than 0, select the cell to view the underlying search and related information. This data will help you resolve the issue. |
| Issues by source type <variable> by source | The <variable> value depends on the selected sourcetype. The results table lists the following information:
|
Interpret data quality results
This section discusses how to check the quality of your data and how to repair issues you may encounter. However, the concept of data quality depends on what factors you use to judge quality. For the purposes of this section, data quality means that the data is correctly parsed.
Guidelines
Finding and repairing data quality issues is unique to each environment. However, using the following guidelines can help you address your data quality:
- It's a good idea to check your most important data sources first. Often, you can have the most impact by making a few changes to a critical data source.
- Data quality issues may generate hundreds or thousands of errors due to one root cause. Sort by volume and work on repairing the source that generates the largest volume of errors first.
- Repairing data quality issues is an iterative process. Repair your most critical data sources first, and then run queries against the source again to see what problems remain.
- For your most critical source, resolve all data quality issues. This helps to ensure that your searches are effective and your performance is optimal.
- Run these checks on a regular cadence to keep your system healthy.
For more information, see Resolve data quality issues in the Splunk Cloud Platform Getting Data In manual.
Example
The following example shows the process of resolving a common data quality issue using information from the CMC Data Quality dashboard, specifically, resolving timestamp parsing issues in a source. The steps to resolve your particular data quality issues may differ, but you can use this example as a general template for resolving data quality issues.
- In the Data Quality dashboard, view the Event Processing Issues by Source Type panel. For this example, you are most concerned with timestamp errors in the syslog source, so you need to drill down into that source.
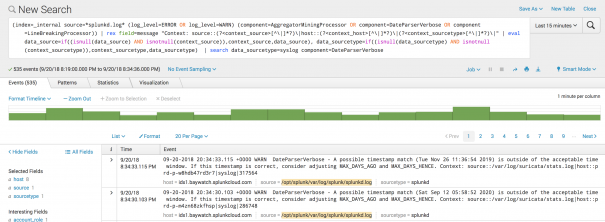
- Drilling down, you can see that the majority of issues are with the following source:
/var/log/suricata/stats.log. - Select the source to drill down further and see the searches against this source.
- From here, you can look at a specific event. You can see that the issue is that the Splunk platform was unable to parse the timestamp in the MAX_TIMESTAMP_LOOKAHEAD field.
- To fix this, go to Settings in the search bar and select Source types in the DATA section.
- In the filter, enter syslog for the source type.
- Select Actions > Edit. The Edit Source Type page opens.
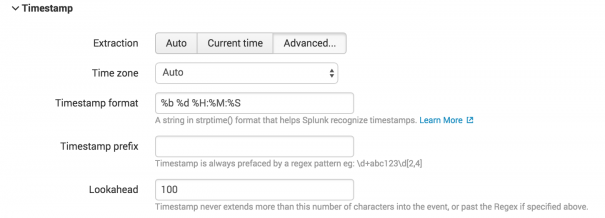
- Select Timestamp > Advanced… to open the Timestamp page for editing. Ensure you are satisfied with the timestamp format and the Lookahead settings. In this case, you need to edit the Lookahead settings so that the Splunk platform can parse the timestamp correctly.
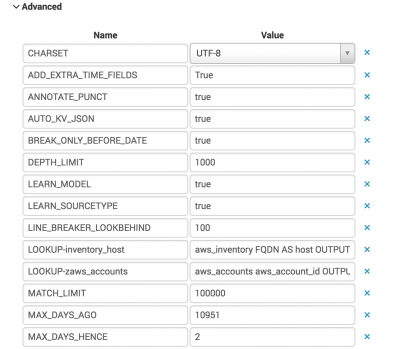
- Return to the main Edit Source Type page and go to the Advanced menu. From here you can make other changes if needed.

| Use the Alerts dashboard | Use the Search dashboards |
This documentation applies to the following versions of Splunk Cloud Platform™: 8.2.2112, 8.2.2201, 8.2.2202, 8.2.2203, 9.0.2205, 9.0.2208, 9.0.2209, 9.0.2303, 9.0.2305, 9.1.2308, 9.1.2312, 9.2.2403, 9.2.2406, 9.3.2408, 9.3.2411 (latest FedRAMP release)


 Download manual
Feedback submitted, thanks!