Part 5 Add area charts using chain searches
Let's say that you want to show how the number of purchases at Buttercup Games changes over a particular time. Similarly, you want to show this same metric, but broken down into game categories, such as arcade, shooter, and sports. In this part of the tutorial, create two area charts using a base search and two chain searches.
Add a base search
Large dashboards can expend a lot of unnecessary computing power when they use repetitive Search Processing Language (SPL) in separate searches to power multiple visualizations. You can reduce the amount of computing power expended using base and chain searches.
A base search is the beginning section of SPL appearing in more than one search. You can extend the base search using additional chain searches to power different visualizations. After separating the initial base search from diverging chain searches, the base search only runs once for all visualizations.
For this tutorial, you want to power two area charts with the following searches.
SPL 1
index=main sourcetype=access_* status=200 action=purchase
| fields _time categoryId clientip
| timechart count by categoryId
SPL 2
index=main sourcetype=access_* status=200 action=purchase
| fields _time categoryId clientip
| chart span=1d count(clientip) as "Customer Purchases" over _time
Both searches share the same initial SPL. Rather than generate two searches with identical initial SPLs, you can reduce resource consumption by constructing a series of one base search and two chain searches. The base search doesn't need to be assigned to any particular visualization, but you can add and assign the chain searches to create two different area charts. See Chain searches together with a base search and chain searches.
- Select the data overview icon (
 ) in the editing toolbar. In the Data Overview panel, you can see a list of available searches.
 - Select + Create Search and name it Purchases. This is the base search.
- Add your search. For this tutorial, copy and paste the following search into the Search with SPL box:
index=main sourcetype=access_* status=200 action=purchase
| fields _time categoryId clientip
Base searches must include a transforming command. Non-transforming base searches can cause search result and timeout issues. If the base search is a non-transforming search, you must use the
| fieldscommand in the base search and explicitly state the fields used in the post-process search. - Expand the Code section and change the Data Source ID to ds_purchases.
- Select Save.
Add chain searches
Now that you've generated a base search, add extensions to your base search by building new chain searches.
- In the Data Overview panel, select + Create Chain Search.
- Name the source Purchase Trends and select Purchases in the Parent Search drop-down menu.
- Add your extended search. For this tutorial, copy and paste the following search into the Search with SPL box:
| timechart count by categoryId
- Expand the Code section and change the Data Source ID to ds_purchase_trends.
- Select Save.
- Repeat steps 1–5 to add an additional chain search, but enter the following fields instead:
- Data Source Name: Customer Purchases
- Parent Search: Purchases
- Search with SPL:
| chart span=1d count(clientip) as "Customer Purchases" over _time
- Data Source ID: ds_customer_purchases
Create area charts
Now, use the two chain searches to power area charts that showcase purchasing trends for Buttercup Games. By constructing base and chain searches, you can create multiple visualizations that use the same base search, but different chain searches.
Purchase trends
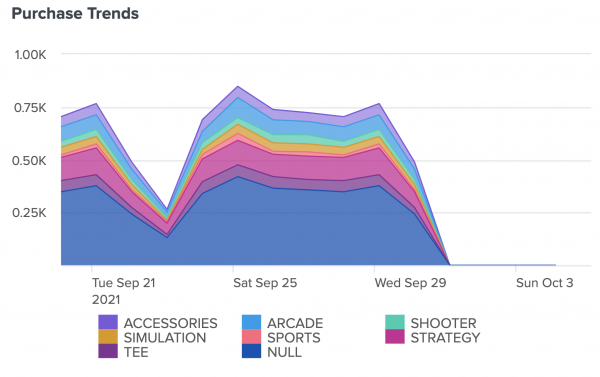
Because data sources in Splunk Dashboard Studio exist separately from their assigned visualizations, you can create a visualization after adding a search in Splunk Dashboard Studio. Create an area chart using the Purchase Trends search that you added previously.
- Select the add chart icon (
 ) in the editing toolbar, and then select Area.
 - By default, the New Data Source panel pops up. Because you want to select an existing data source, select Cancel.
- Title your chart Purchase Trends and leave the description box empty.
- In the Data Configurations section of the Configuration panel, select + Set up Primary Data Source and choose the Purchase Trends chain search that you added previously.
- In the General section, follow these steps:
- Leave the gaps icon (
 ) option for Null Values set at null. The gaps option creates a space in the chart to represent a null value instead of inserting a value of zero.
 - Select the stacked icon (
 ) option for Stack Mode. The stacked option builds the area for each value vertically on top of one another instead of creating layers beginning at the x-axis.
- Leave the gaps icon (
- In the Legend section, change the Position option to Bottom.
- The Truncation setting defaults to A... and specifies how labels are abbreviated when the dashboard doesn't have space to display full-length labels.
- Expand the Code section and change the Visualization ID to viz_purchaseTrends.
- Move and resize your area chart to the center of the bottom right gray rectangle.
- In the General section of the Configuration panel, change the Background to transparent.
- For Dashboard Studio in Splunk Enterprise, you can change the background color by opening the source editor and adding the option
"backgroundColor": "transparent".
- For Dashboard Studio in Splunk Enterprise, you can change the background color by opening the source editor and adding the option
Your first area chart looks similar to this:
Number of customers making purchases
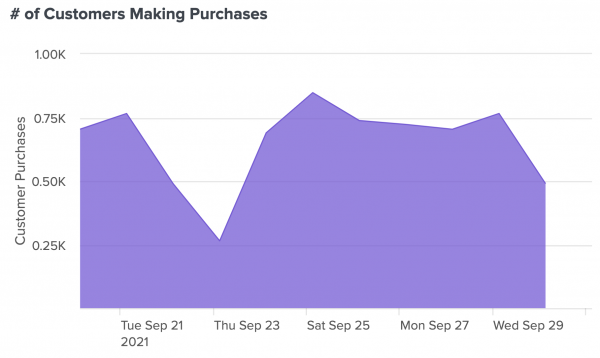
Create an additional area chart using the same Purchases base search, but instead use the Customer Purchases chain search.
- Select the add chart icon (
 ) in the editing toolbar, and then select Area.
 - By default, the New Data Source panel pops up. Because you want to select an existing data source, select Cancel.
- Title your chart # of Customers Making Purchases and leave the description box empty.
- In the Data Configurations section of the Configuration panel, select + Set up Primary Data Source, and then choose the Customer Purchases chain search that you added previously.
- In the Legend section, change the Position to Off.
- For Dashboard Studio in Splunk Enterprise, in the Legend section, change the Position to None.
- Expand the Code section and change the Visualization ID to viz_customerPurchases.
- Move and resize your area chart to the center of the top right gray rectangle.
- In the General section of the Configuration panel, change the Background to transparent.
- For Dashboard Studio in Splunk Enterprise, you can change the background color by opening the source editor and adding the option
"backgroundColor": "transparent".
- For Dashboard Studio in Splunk Enterprise, you can change the background color by opening the source editor and adding the option
Your second area chart looks similar to this:
Next step
You've completed Part 5 of the Splunk Dashboard Studio tutorial.
Now your dashboard has two area charts. Next, add a single value visualization using the base search you created in Part 5. Continue to Part 6: Add a single value visualization.
| Part 4 Add a pie chart visualization | Part 6 Add a single value visualization |
This documentation applies to the following versions of Splunk Cloud Platform™: 8.2.2112, 8.2.2201, 8.2.2202


 Download manual
Feedback submitted, thanks!