Configure Splunk Observability Cloud previews
Splunk Cloud Platform users can see previews of observability data that correlates to search results in the Search & Reporting application (the Search app) when you set up Splunk Observability Cloud Related Content previews. An administrator must connect your Splunk Cloud Platform and Splunk Observability Cloud accounts. Users can then see previews of observability data in a Related Content panel and jump into Splunk Observability Cloud in context for troubleshooting.
Prerequisites
To set up Splunk Observability Cloud Related Content in Splunk Cloud Platform, a user must have an administrator role in both Splunk Cloud Platform and Splunk Observability Cloud.
Configure Splunk Observability Cloud previews
To connect accounts and activate data correlation previews, an administrator must do the following:
- Open the Discover Splunk Observability Cloud app in Splunk Cloud Platform, and complete each of the following sections:
- In Splunk Cloud Platform, turn on the read_o11y_content capability for roles that you want to have access to observability previews. The sc_admin and power roles have the read_o11y_content role automatically active.
- Turn on the Read permission to the Discover Splunk Observability Cloud app for all users who you want to allow to see related observability data in the Search & Reporting app.
- In Splunk Cloud Platform, in the Apps drop-down menu, select Manage Apps.
- Search for the Discover Splunk Observability Cloud app, then in the Sharing column, select Permissions.
- Select the roles to which you want to give the Read permission for the Discover Splunk Observability Cloud app. The roles can now see related Splunk Observability Cloud content on the Search & Reporting page.
- If you are using the Firefox extension, uBlock Origin, turn it off. If uBlock Origin is on, it blocks the Splunk Observability Cloud previews.
If a non-admin role gets Read access to the Discover Splunk Observability Cloud app, they can open the app but cannot access or edit configurations.
Access tokens
1. In Splunk Observability Cloud, retrieve an API access token. See Create and manage organization access tokens using Splunk Observability Cloud to learn how.
2. On the Access tokens section of the Discover Splunk Observability Cloud app, enter your Splunk Observability Cloud realm in the Realm field. In the Access token field, paste the Splunk Observability Cloud API access token you retrieved in step 1, then select Save.
Supported realms include us0, us1, eu0, eu1, eu2, jp0, and au0.
Automatic UI updates
Turn on the toggle next to See data previews from Splunk Observability Cloud in Splunk Cloud Platform. You must turn on automatic UI updates to see real-time Splunk Observability Cloud data in the Search app.
Field aliasing (optional)
To correlate search results in the Search & Reporting app with related observability data, your field names for host, service, and trace id must match the names for those fields in Splunk Observability Cloud. Decide whether you want to use Auto Field Mapping or create your own field aliases to align field names that do not match. Select the Enable Auto Field Mapping toggle to alias fields automatically. Select Open field aliasing to alias field names manually in Splunk Cloud Platform.
Auto Field Mapping
Auto Field Mapping matches Splunk Observability Cloud Related Content field keys (host.name, service.name, and trace_id fields) to alternative versions of those field names that your event data might use, such as host, service, or trace.id.
The following table shows which alternative field names will be automatically mapped to the Splunk Observability Cloud Related Content field keys, host.name, service.name, and trace_id:
| If your data has these field names | Splunk Observability Cloud maps them to these field names |
|---|---|
|
host.name |
|
service.name |
|
trace_id |
1. Select Test now in the Search & Reporting application to test your configuration in a new tab.
2. In the new tab showing the Search & Reporting app, select a sample log to show details.
3. Next to any field for which there is correlated Splunk Observability Cloud data, you see the Preview link. Check for the Preview link next to the host.name, service.name, and trace_id fields.
4. Select Preview to open the Related Content panel.
The Related Content panel shows the following Splunk Observability Cloud data previews:
| Splunk Cloud Platform field | Splunk Observability Cloud related data |
|---|---|
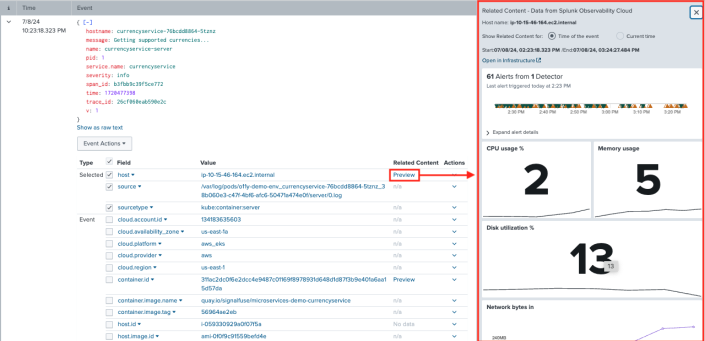
| host.name | CPU utilization, memory usage, disk utilization, network bytes in, network bytes out, tags |
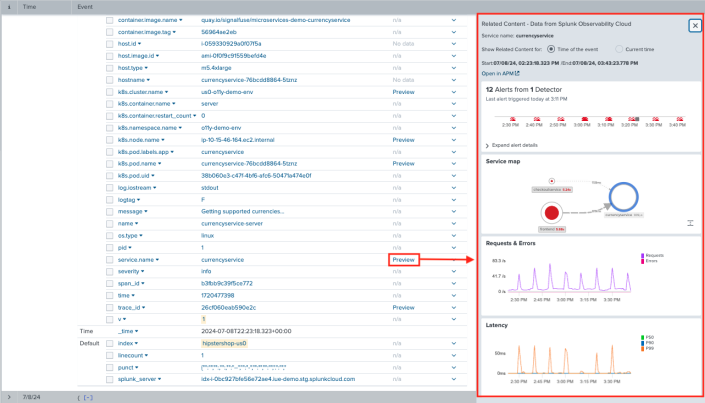
| service.name | Service dependency map, latency graph, error rate graph |
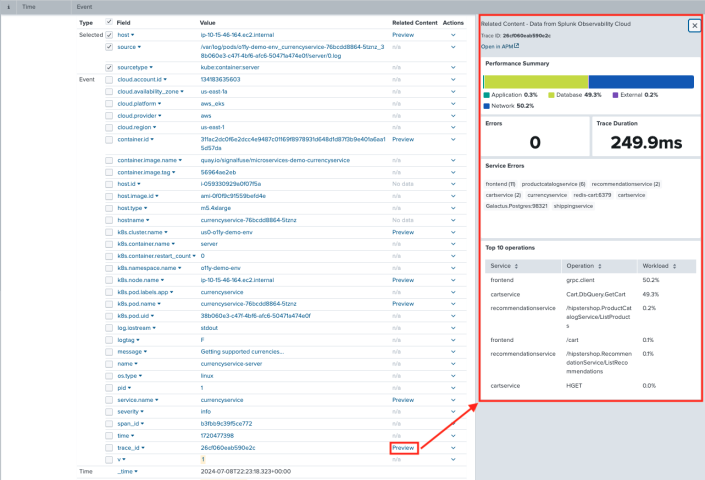
| trace_id | Errors, trace duration, service errors, top 10 operations |
| k8s.cluster.name | Kubernetes cluster name |
| k8s.node.name | Kubernetes node name |
| k8s.pod.name | Kubernetes pod name |
| container.id | Kubernetes container ID |
Related Content previews: Examples
The following sections show sample previews of observability data in the Search app and how to drill down on the data in context in Splunk Observability Cloud.
Host data previews
The following screenshot shows previews of host.name data from Splunk Observability Cloud on the Related Content panel:
Select Open in Infrastructure to open the host data in context in Splunk Infrastructure Monitoring.
Service data previews
The following screenshot shows previews of service.name data from Splunk Observability Cloud on the Related Content panel:
Select Open in APM to open the service data in context in Splunk APM.
Trace data previews
The following screenshot shows previews of trace_id data from Splunk Observability Cloud on the Related Content panel:
Select Open in APM to open the trace data in context in Splunk APM.
See also
To learn how to use Related Content to preview observability data, see Preview Splunk Observability Cloud data.
| Preview events | Preview observability data in the Related Content panel |
This documentation applies to the following versions of Splunk Cloud Platform™: 9.1.2312, 9.2.2403, 9.2.2406, 9.3.2408 (latest FedRAMP release), 9.3.2411


 Download manual
Feedback submitted, thanks!