transpose
Description
Returns the specified number of rows (search results) as columns (list of field values), such that each search row becomes a column.
Syntax
The required syntax is in bold.
- transpose
- [int]
- [column_name=<string>]
- [header_field=<field>]
- [include_empty=<bool>]
Required arguments
None.
Optional arguments
- column_name
- Syntax: column_name=<string>
- Description: The name of the first column that you want to use for the transposed rows. This column contains the names of the fields.
- Default: column
- header_field
- Syntax: header_field=<field>
- Description: The field in your results to use for the names of the columns (other than the first column) in the transposed data.
- Default: row 1, row 2, row 3, and so on.
- include_empty
- Syntax: include_empty=<bool>
- Description: Specify whether to include (true) or not include (false) fields that contain empty values.
- Default: true
- int
- Syntax: <int>
- Description: Limit the number of rows to transpose. To transpose all rows, specify
| transpose 0, which indicates that the number of rows to transpose is unlimited. - Default: 5
Usage
When you use the transpose command the field names used in the output are based on the arguments that you use with the command. By default the field names are: column, row 1, row 2, and so forth.
Examples
1. Transpose the results of a chart command
Use the default settings for the transpose command to transpose the results of a chart command.
Suppose you run a search like this:
sourcetype=access_* status=200 | chart count BY host
The search produces the following search results:
| host | count |
|---|---|
| www1 | 11835 |
| www2 | 11186 |
| www3 | 11261 |
When you add the transpose command to the end of the search, the results look something like this:
| column | row 1 | row 2 | row 3 |
|---|---|---|---|
| host | www1 | www2 | www3 |
| count | 11835 | 11186 | 11261 |
2. Specifying a header field
In the previous example, the default settings for the transpose command are used in the search:
sourcetype=access_* status=200 | chart count BY host | transpose
The results look like this:
| column | row 1 | row 2 | row 3 |
|---|---|---|---|
| host | www1 | www2 | www3 |
| count | 11835 | 11186 | 11261 |
Instead of using the default field names like row 1, row 2, and so forth, you can use the values in a field for the field names by specifying the header_field argument.
sourcetype=access_* status=200 | chart count BY host | transpose header_field=host
The results look like this:
| column | www1 | www2 | www3 |
|---|---|---|---|
| count | 11835 | 11186 | 11261 |
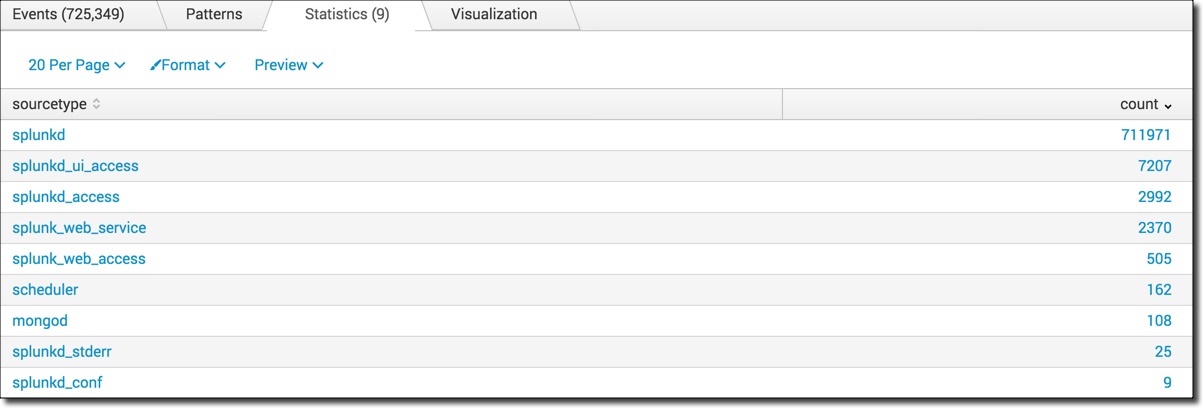
3. Count the number of events by sourcetype and transpose the results to display the 3 highest counts
Count the number of events by sourcetype and display the sourcetypes with the highest count first.
index=_internal | stats count by sourcetype | sort -count
Use the transpose command to convert the rows to columns and show the source types with the 3 highest counts.
index=_internal | stats count by sourcetype | sort -count | transpose 3
4. Transpose a set of data into a series to produce a chart
This example uses the sample dataset from the Search Tutorial.
|
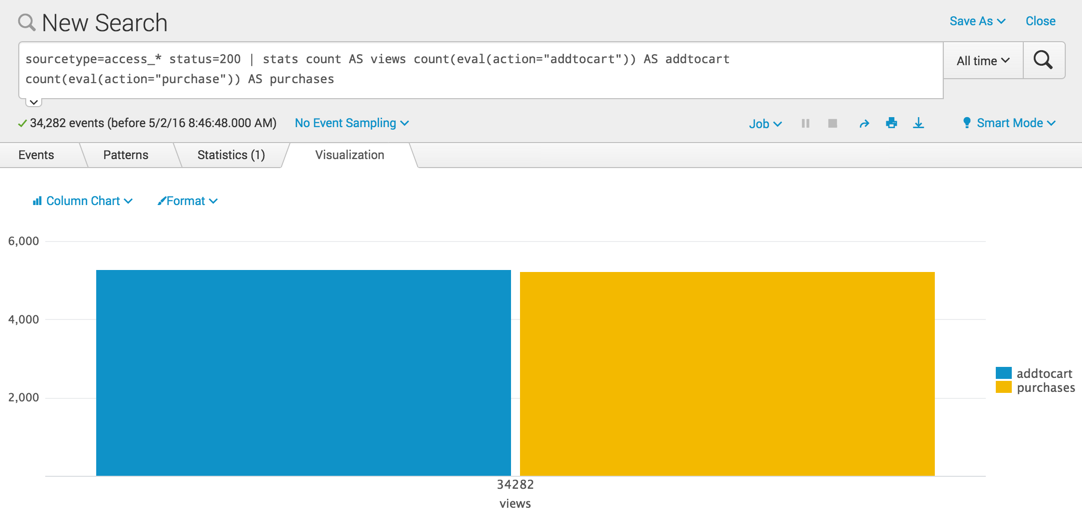
Search all successful events and count the number of views, the number of times items were added to the cart, and the number of purchases.
sourcetype=access_* status=200 | stats count AS views count(eval(action="addtocart")) AS addtocart count(eval(action="purchase")) AS purchases
This search produces a single row of data.

The value for count AS views is the total number of the events that match the criteria sourcetype=access_* status=200, or the total count for all actions. The values for addtocart and purchases show the number of events for those specific actions.
When you switch to the Visualization tab, the data displays a chart with the "34282 views" as the X axis label and two columns, one for "addtocart "and one for "purchases". Because the information about the views is placed on the X axis, this chart is confusing.
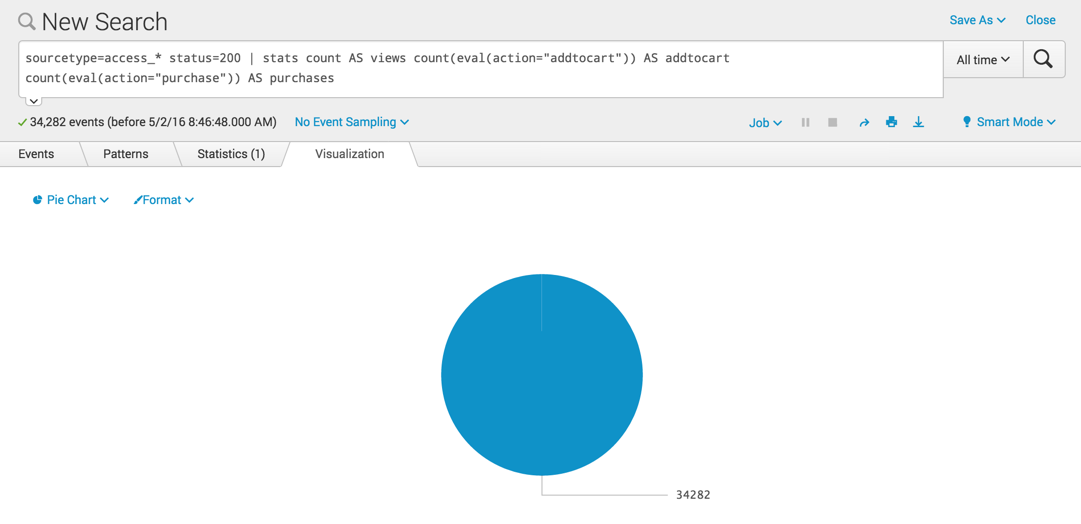
If you change to a pie chart, you see only the "views".
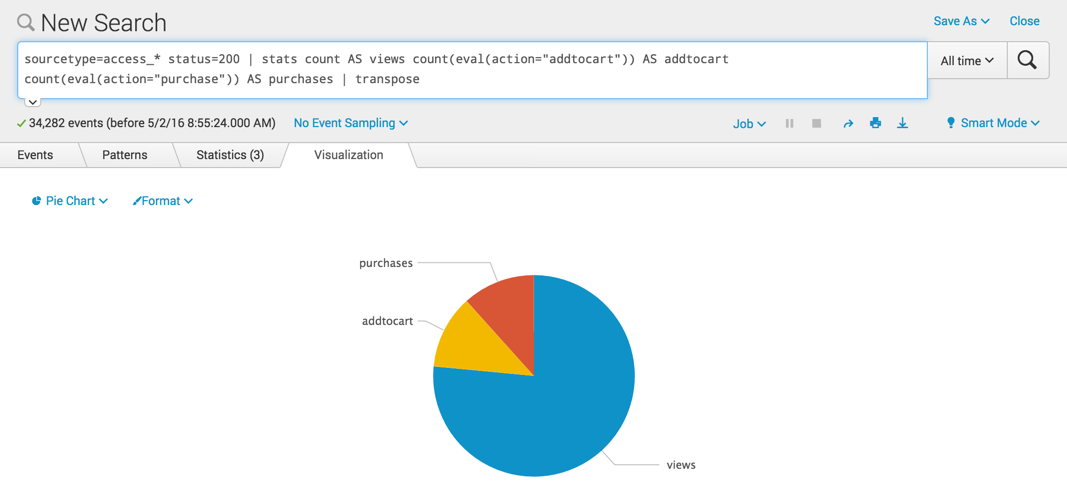
Use the transpose command to convert the columns of the single row into multiple rows.
sourcetype=access_* status=200 | stats count AS views count(eval(action="addtocart")) AS addtocart count(eval(action="purchase")) AS purchases | transpose
Now these rows can be displayed in a column or pie chart where you can compare the values.
In this particular example, using a pie chart is misleading. The views is a total count of all the actions, not just the addtocart and purchases actions. Using a pie chart implies that views is an action like addtocart and purchases. The pie chart implies that the value for views is 1 part of the total, when in fact views is the total.
There are a few ways to fix this issue:
- Use a column chart
- You can remove the
count AS viewscriteria from your search - You can add the
tablecommand before thetransposecommand in the search, for example:
sourcetype=access_* status=200 | stats count AS views count(eval(action="addtocart")) AS addtocart count(eval(action="purchase")) AS purchases | table addtocart purchases | transpose
See also
| transaction | trendline |
This documentation applies to the following versions of Splunk Cloud Platform™: 9.3.2411, 8.2.2112, 8.2.2201, 8.2.2203, 8.2.2202, 9.0.2205, 9.0.2208, 9.0.2209, 9.0.2303, 9.0.2305, 9.1.2308, 9.1.2312, 9.2.2403, 9.2.2406, 9.3.2408 (latest FedRAMP release)


 Download manual
Feedback submitted, thanks!