Use the search language
The searches that you have run to this point have retrieved events from your Splunk index. You were limited to asking questions that could only be answered by the number of events returned.
For example, you ran the following search to determine how many simulation games were purchased:
sourcetype=access_* status=200 action=purchase categoryId=simulation
To find this number for the days of the previous week, you need to run it against the data for each day of that week. To see which products are more popular than the other, run the search for each of the eight categoryId values and compare the results.
Splunk developed the Search Processing Language (SPL) to use with Splunk software. SPL encompasses all the search commands and their functions, arguments, and clauses. One way to learn the SPL language is by using the Search Assistant.
Learn with the Search Assistant
There are two modes for the Search Assistant: Compact and Full. The default mode is Compact, which you were introduced to in the Basic searches and search results topic in this tutorial.
This section shows you how to change the Search Assistant mode. You will use the Search Assistant to learn about the SPL and to construct searches. If you have a Splunk Free license, you will not be able to change the Search Assistant mode. See Choose a platform to learn about difference between the Splunk Trial and Splunk Free licenses.
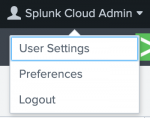
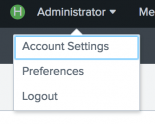
You change the Search Assistant mode through the Account menu:
| Splunk Cloud Platform Account menu | Splunk Enterprise Account menu |
|---|---|
Let's change the Search Assistant mode to Full:
- From the Account menu, select Preferences.
- Click SPL Editor.
- On the General tab next to Search assistant, click Full.
The default setting is Compact. You can tell which mode is set by the dark gray background on the mode. The Full mode provides more information as you type commands in the Search bar. - Click Apply.
Let's explore the benefits of the Full mode and creating searches using the SPL commands.
- Click Search in the App bar to start a new search.
- Change the time range to All time.
- Type the letter s in the Search bar.
The Search Assistant shows a list of Matching Searches and Matching Terms. It also explains briefly How To Search.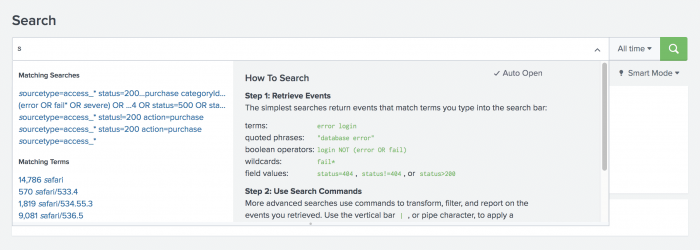
- Select the following search from the Matching Searches list, or type the search into the Search bar.
sourcetype=access_* status=200 action=purchase - After action=purchase, type a pipe character ( | ) into the Search bar.
The pipe character indicates that you are about to use a command. The results of the search to the left of the pipe are used as the input to the command to the right of the pipe. You can pass the results of one command into another command in a series, or pipeline, of search commands.
Notice that the Search Assistant changes to show a list of Common Next Commands.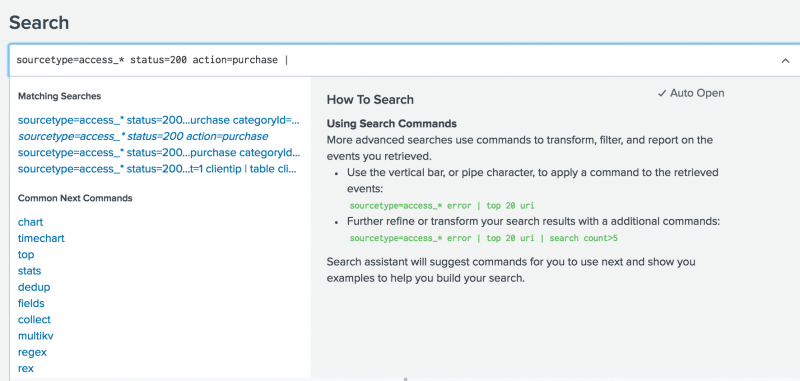
You want the search to return the most popular items bought at the Buttercup Games online store. - Under Common Next Commands, select top.
Thetopcommand is appended to your search string.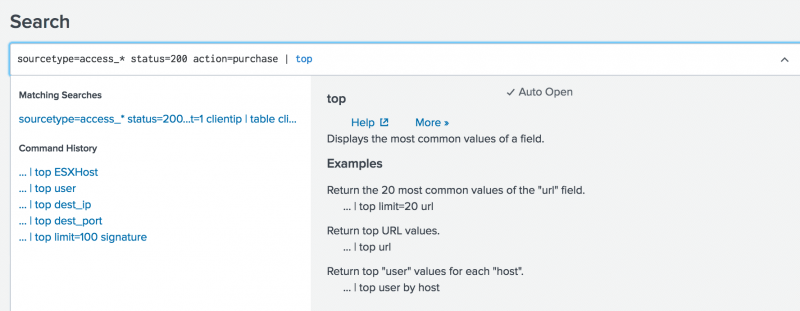
- Type
categoryIdinto the Search bar.
The following search is the complete search string.sourcetype=access_* status=200 action=purchase | top categoryId- The search criteria before the pipe character,
sourcetype=access_* status=200 action=purchase, locates events from the access control log files, that were successful (HTTP status is 200), and that were a purchase of a product. - The search criteria after the pipe character,
top categoryId, takes the events located and returns thecategoryIdfield for the most common values.
- The search criteria before the pipe character,
- Run the search.
The results of thetopcommand appear in the Statistics tab.
View results in the Statistics tab
The top command is a transforming command. Transforming commands organize the search results into a table. Use transforming commands to generate results that you can use to create visualizations such as column, line, area, and pie charts. You will learn more about visualizations later in this tutorial.
Because transforming commands return your search results in a table format, the results appear on the Statistics tab.
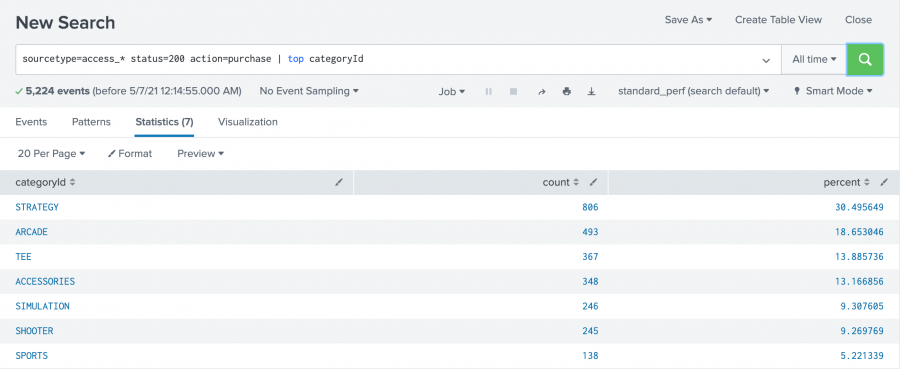
In this search for successful purchases, seven different category IDs were found. The list shows the category ID values from highest to lowest, based on the frequency of the category ID values in the events.
Many of the transforming commands return additional fields that contain useful statistical information. The top command returns two new fields, count and percent.
- The
countfield specifies the number of times each value of thecategoryIdfield occurs in the search results. - The
percentfield specifies how large the count is compared to the total count.
View and format results on the Visualization tab
You can also view the results of transforming searches on the Visualization tab, where you can format the chart type.
- Click the Visualization tab.
By default, the Visualization tab opens with a Column chart. - Click Column Chart to open the visualization type selector.
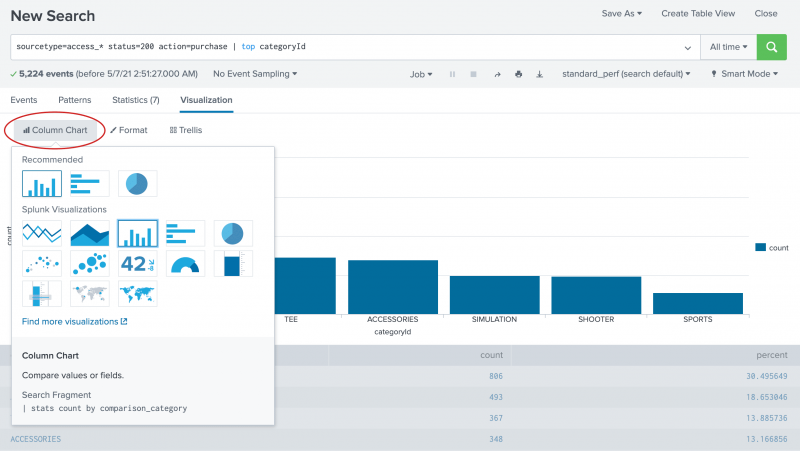
Column, Bar, and Pie charts are listed as the Recommended chart type for this data set. - Select the Pie chart.
Now, your visualization looks like the following pie chart.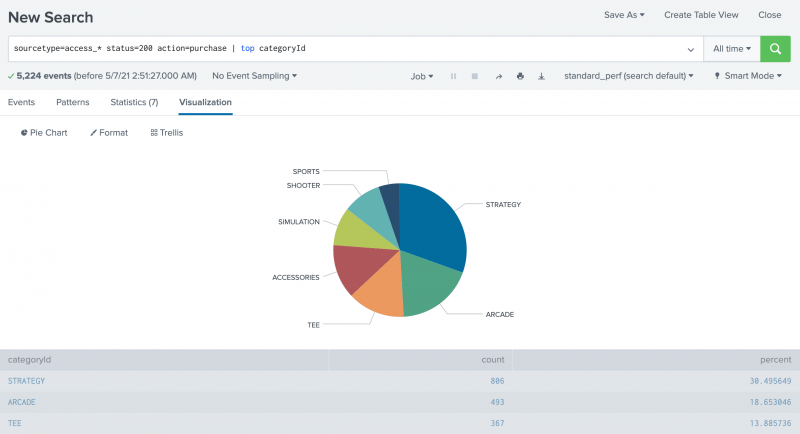
- Hover over each slice of the pie to see the
countandpercentagevalues for eachcategoryId.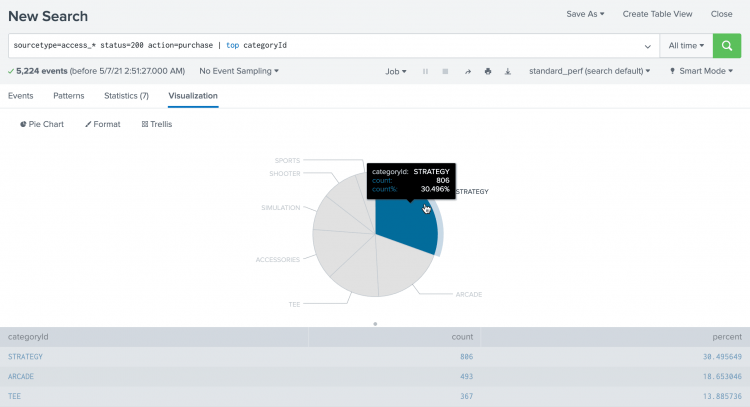
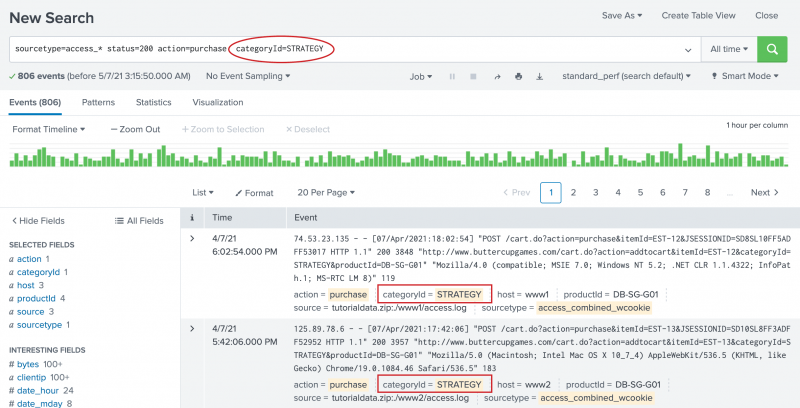
- Click on the STRATEGY slice.
categoryId=STRATEGYis added to your search string, replacing thetopcommand. The search runs again.
Next step
Learn about correlating events with subsearches.
See also
The top command in the Search Reference
Use drilldown for dashboard interactivity in the Dashboards and Visualizations
| Use fields to search | Use a subsearch |
This documentation applies to the following versions of Splunk Cloud Platform™: 9.3.2411, 8.2.2201, 8.2.2202, 8.2.2203, 9.0.2205, 8.2.2112, 9.0.2209, 9.0.2208, 9.0.2303, 9.0.2305, 9.1.2308, 9.1.2312, 9.2.2403, 9.2.2406, 9.3.2408 (latest FedRAMP release)
 Download manual
Feedback submitted, thanks!