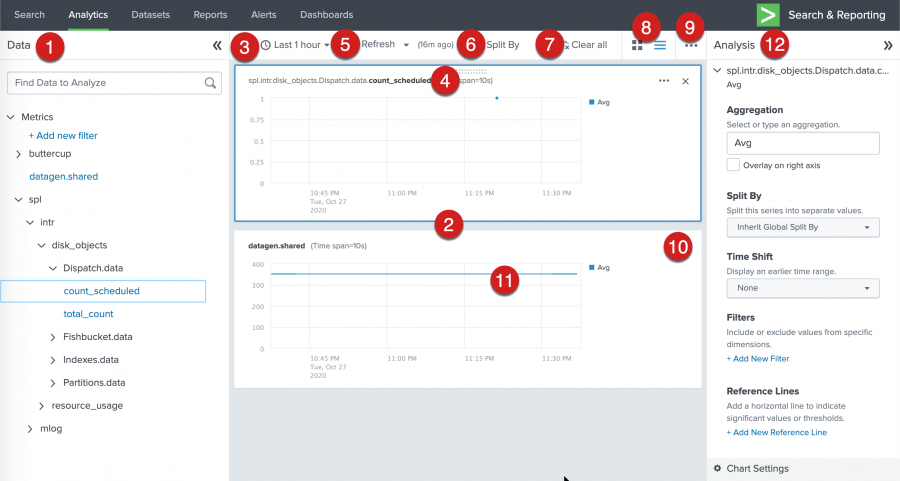
The Analytics Workspace contains three panels. The left-side Data panel shows all data sources that are available for analysis. The main panel in the center is where you see your data represented in charts. The right-side Analysis panel lists the aggregations and analytic functions that you can apply to your data.
| Number | Element | Description |
|---|---|---|
| 1 | Data panel | Search or browse for data to view and analyze. |
| 2 | Main (center) panel | View and manipulate time series of your data. |
| 3 | Time range picker | Select a common time range to display for all charts. |
| 4 | Chart title | Chart titles consist of the data source name. |
| 5 | Refresh | Refresh charts to include the most recent data. Refresh manually or enable auto-refresh. |
| 6 | Split By | Split a time series by a dimension to view a separate time series for each dimension value. |
| 7 | Clear all | Clear all charts from the workspace. |
| 8 | Grid layout or stack layout | Display charts in grid layout, which displays multiple charts in each row, or stack layout, which displays one chart per row. |
| 9 | More workspace options | Save all charts in the workspace to a dashboard. |
| 10 | More chart options | Open chart in search, search for related events, save as alert, save as dashboard panel, save as report, clone panel, or export as PNG or CSV. |
| 11 | Pinpoint time range | Hover to view a shared hairline on all charts. Click and drag to zoom in on a narrower time range. |
| 12 | Analysis panel | Perform analytic functions and operations. |
| Open the Analytics Workspace | Types of data in the Analytics Workspace |
This documentation applies to the following versions of Splunk Cloud Platform™: 9.3.2411, 8.2.2201, 8.2.2202, 8.2.2203, 9.0.2205, 8.2.2112, 9.0.2209, 9.0.2208, 9.0.2303, 9.0.2305, 9.1.2308, 9.1.2312, 9.2.2403, 9.2.2406, 9.3.2408 (latest FedRAMP release)

 Download manual
Feedback submitted, thanks!