timechart
Description
Creates a time series chart with corresponding table of statistics.
A timechart is a statistical aggregation applied to a field to produce a chart, with time used as the X-axis. You can specify a split-by field, where each distinct value of the split-by field becomes a series in the chart. If you use an eval expression, the split-by clause is required. With the limit and agg options, you can specify series filtering. These options are ignored if you specify an explicit where-clause. If you set limit=0, no series filtering occurs.
Syntax
The required syntax is in bold.
- timechart
- [sep=<string>]
- [format=<string>]
- [partial=<bool>]
- [cont=<bool>]
- [limit=<chart-limit-opt>]
- [agg=<stats-agg-term>]
- [<bin-options>... ]
- ( (<single-agg> [BY <split-by-clause>] ) | (<eval-expression>) BY <split-by-clause> )
- [<dedup_splitvals>]
Required arguments
When specifying timechart command arguments, either <single-agg> or <eval-expression> BY <split-by-clause> is required.
- eval-expression
- Syntax: <math-exp> | <concat-exp> | <compare-exp> | <bool-exp> | <function-call>
- Description: A combination of literals, fields, operators, and functions that represent the value of your destination field. For these evaluations to work, your values need to be valid for the type of operation. For example, with the exception of addition, arithmetic operations might not produce valid results if the values are not numerical. Additionally, the search can concatenate the two operands if they are both strings. When concatenating values with a period '.' the search treats both values as strings, regardless of their actual data type.
- single-agg
- Syntax: count | <stats-func>(<field>)
- Description: A single aggregation applied to a single field, including an evaluated field. For <stats-func>, see Stats function options. No wildcards are allowed. The field must be specified, except when using the
countfunction, which applies to events as a whole.
- split-by-clause
- Syntax: <field> (<tc-options>)... [<where-clause>]
- Description: Specifies a field to split the results by. If field is numerical, default discretization is applied. Discretization is defined with the
tc-options. Use the <where-clause> to specify the number of columns to include. See the tc options and the where clause sections in this topic.
Optional arguments
- agg=<stats-agg-term>
- Syntax:agg=( <stats-func> ( <evaled-field> | <wc-field> ) [AS <wc-field>] )
- Description: A statistical aggregation function. See Stats function options. The function can be applied to an eval expression, or to a field or set of fields. Use the AS clause to place the result into a new field with a name that you specify. You can use wild card characters in field names.
- bin-options
- Syntax: bins | minspan | span | <start-end> | aligntime
- Description: Options that you can use to specify discrete bins, or groups, to organize the information. The
bin-optionsset the maximum number of bins, not the target number of bins. See the Bin options section in this topic. - Default: bins=100
- cont
- Syntax: cont=<bool>
- Description: Specifies whether the chart is continuous or not. If set to
true, the Search application fills in the time gaps. - Default: true
- dedup_splitvals
- Syntax: dedup_splitvals=<boolean>
- Description: Specifies whether to remove duplicate values in multivalued
<split-by-clause>fields. - Default: false
- fixedrange
- Syntax: fixedrange=<bool>
- Description: Specifies whether or not to enforce the earliest and latest times of the search. Setting
fixedrange=falseallows thetimechartcommand to constrict or expand to the time range covered by all events in the dataset. - Default: true
- format
- Syntax: format=<string>
- Description: Used to construct output field names when multiple data series are used in conjunction with a split-by-field.
formattakes precedence oversepand allows you to specify a parameterized expression with the stats aggregator and function ($AGG$) and the value of the split-by-field ($VAL$).
- limit
- Syntax: limit=(top | bottom)<int>
- Description: Specifies a limit for the number of distinct values of the split-by field to return. If set to
limit=0, all distinct values are used. Settinglimit=Norlimit=topNkeeps the N highest scoring distinct values of thesplit-byfield. Settinglimit=bottomNkeeps the lowest scoring distinct values of thesplit-byfield. All other values are grouped into 'OTHER', as long asuseotheris not set to false. The scoring is determined as follows:- If a single aggregation is specified, the score is based on the sum of the values in the aggregation for that split-by value. For example, for
timechart avg(host) BY <field>, theavg(host)values are added up for each value of <field> to determine the scores. - If multiple aggregations are specified, the score is based on the frequency of each value of <field>. For example, for
timechart avg(host) max(amount) BY <field>, the top scoring values for <field> are the most common values of <field>.
- If a single aggregation is specified, the score is based on the sum of the values in the aggregation for that split-by value. For example, for
- Ties in scoring are broken lexicographically, based on the value of the
split-byfield. For example, 'AMOUNT' takes precedence over 'amount', which takes precedence over 'host'. See Usage. - Default: top10
- partial
- Syntax: partial=<bool>
- Description: Controls if partial time bins should be retained or not. Only the first and last bin can be partial.
- Default: True. Partial time bins are retained.
- sep
- Syntax: sep=<string>
- Description: Used to construct output field names when multiple data series are used in conjunctions with a split-by field. This is equivalent to setting
formatto$AGG$<sep>$VAL$.
Stats function options
- stats-func
- Syntax: The syntax depends on the function that you use. See Usage.
- Description: Statistical functions that you can use with the
timechartcommand. Each time you invoke thetimechartcommand, you can use one or more functions. However, you can only use oneBYclause.
Bin options
- bins
- Syntax: bins=<int>
- Description: Sets the maximum number of bins to discretize into. This does not set the target number of bins. It finds the smallest bin size that results in no more than N distinct bins. Even though you specify a number such as 300, the resulting number of bins might be much lower.
- Default: 100
- minspan
- Syntax: minspan=<span-length>
- Description: Specifies the smallest span granularity to use automatically inferring span from the data time range. See Usage.
- span
- Syntax: span=<log-span> | span=<span-length> | span=<snap-to-time>
- Description: Sets the size of each bin, using either a log-based span, a span length based on time, or a span that snaps to a specific time. For descriptions of each of these options, see Span options.
- The starting time of a bin might not match your local timezone. see Usage.
- <start-end>
- Syntax: end=<num> | start=<num>
- Description: Sets the minimum and maximum extents for numerical bins. Data outside of the [start, end] range is discarded.
- aligntime
- Syntax: aligntime=(earliest | latest | <time-specifier>)
- Description: Align the bin times to something other than base UNIX time (epoch 0). The
aligntimeoption is valid only when doing a time-based discretization. Ignored ifspanis in days, months, or years.
Span options
- <log-span>
- Syntax: [<num>]log[<num>]
- Description: Sets to log-based span. The first number is a coefficient. The second number is the base. If the first number is supplied, it must be a real number >= 1.0 and < base. Base, if supplied, must be real number > 1.0 (strictly greater than 1).
- <span-length>
- Syntax: <int>[<timescale>]
- Description: A span of each bin, based on time. If the timescale is provided, this is used as a time range. If not, this is an absolute bin length.
- <timescale>
- Syntax: <sec> | <min> | <hr> | <day> | <week> | <month> | <quarter> | <subseconds>
- Description: Timescale units.
- Default: <sec>
Timescale Valid syntax Description <sec> s | sec | secs | second | seconds Time scale in seconds. <min> m | min | mins | minute | minutes Time scale in minutes. <hr> h | hr | hrs | hour | hours Time scale in hours. <day> d | day | days Time scale in days. <week> w | week | weeks Time scale in weeks. <month> mon | month | months Time scale in months. <quarter> q | qtr | qtrs | quarter | quarters Time scale in quarters. <subseconds> us | ms | cs | ds Time scale in microseconds (us), milliseconds (ms), centiseconds (cs), or deciseconds (ds)
- <snap-to-time>
- Syntax: [+|-] [<time_integer>] <relative_time_unit>@<snap_to_time_unit>
- Description: A span of each bin, based on a relative time unit and a snap to time unit. The <snap-to-time> must include a relative_time_unit, the @ symbol, and a snap_to_time_unit. The offset, represented by the plus (+) or minus (-) is optional. If the <time_integer> is not specified, 1 is the default. For example, if you specify w as the relative_time_unit, 1 week is assumed.
tc options
The <tc-option> is part of the <split-by-clause>.
- tc-option
- Syntax: <bin-options> | usenull=<bool> | useother=<bool> | nullstr=<string> | otherstr=<string>
- Description: Timechart options for controlling the behavior of splitting by a field.
- bin-options
-
- See the Bin options section in this topic.
- nullstr
- Syntax: nullstr=<string>
- Description: If
usenull=true, specifies the label for the series that is created for events that do not contain the split-by field. - Default: NULL
- otherstr
- Syntax: otherstr=<string>
- Description: If
useother=true, specifies the label for the series that is created in the table and the graph. - Default: OTHER
- usenull
- Syntax: usenull=<bool>
- Description: Controls whether or not a series is created for events that do not contain the split-by field. The label for the series is controlled by the
nullstroption. - Default: true
- useother
- Syntax: useother=<bool>
- Description: You specify which series to include in the results table by using the <agg>, <limit>, and <where-clause> options. The
useotheroption specifies whether to merge all of the series not included in the results table into a single new series. Ifuseother=true, the label for the series is controlled by theotherstroption. - Default: true
where clause
The <where-clause> is part of the <split-by-clause>. The <where-clause> is comprised of two parts, a single aggregation and some options. See Where clause examples.
- where clause
- Syntax: <single-agg> <where-comp>
- Description: Specifies the criteria for including particular data series when a field is given in the <tc-by-clause>. The most common use of this option is to look for spikes in your data rather than overall mass of distribution in series selection. The default value finds the top ten series by area under the curve. Alternately one could replace sum with max to find the series with the ten highest spikes. Essentially the default is the same as specifying
where sum in top10. The <where-clause> has no relation to thewherecommand.
- <where-comp>
- Syntax: <wherein-comp> | <wherethresh-comp>
- Description: Specify either a grouping for the series or the threshold for the series.
- <wherein-comp>
- Syntax: (in | notin) (top | bottom)<int>
- Description: A grouping criteria that requires the aggregated series value be in or not in some top or bottom group.
- <wherethresh-comp>
- Syntax: (< | >) [" "] <num>
- Description: A threshold criteria that requires the aggregated series value be greater than or less than some numeric threshold. You can specify the threshold with or without a space between the sign and the number.
Usage
The timechart command is a transforming command. See Command types.
bins and span arguments
The timechart command accepts either the bins argument OR the span argument. If you specify both bins and span, span is used. The bins argument is ignored.
If you do not specify either bins or span, the timechart command uses the default bins=100.
Default time spans
If you use the predefined time ranges in the time range picker, and do not specify the span argument, the following table shows the default span that is used.
| Time range | Default span |
|---|---|
| Last 15 minutes | 10 seconds |
| Last 60 minutes | 1 minute |
| Last 4 hours | 5 minutes |
| Last 24 hours | 30 minutes |
| Last 7 days | 1 day |
| Last 30 days | 1 day |
| Previous year | 1 month |
(Thanks to Splunk users MuS and Martin Mueller for their help in compiling this default time span information.)
Spans used when minspan is specified
When you specify a minspan value, the span that is used for the search must be equal to or greater than one of the span threshold values in the following table. For example, if you specify minspan=15m that is equivalent to 900 seconds. The minimum span that can be used is 1800 seconds, or 30 minutes.
| Span threshold | Time equivalents |
|---|---|
| 1 second | |
| 5 seconds | |
| 10 seconds | |
| 30 seconds | |
| 60 seconds | 1 minute |
| 300 seconds | 5 minutes |
| 600 seconds | 10 minutes |
| 1800 seconds | 30 minutes |
| 3600 seconds | 1 hour |
| 86400 seconds | 1 day |
| 2592000 seconds | 30 days |
Bin time spans and local time
The span argument always rounds down the starting date for the first bin. There is no guarantee that the bin start time used by the timechart command corresponds to your local timezone. In part this is due to differences in daylight savings time for different locales. To use day boundaries, use span=1d. Do not use not span=86400s, or span=1440m, or span=24h.
Bin time spans versus per_* functions
The functions, per_day(), per_hour(), per_minute(), and per_second() are aggregator functions and are not responsible for setting a time span for the resultant chart. These functions are used to get a consistent scale for the data when an explicit span is not provided. The resulting span can depend on the search time range.
For example, per_hour() converts the field value so that it is a rate per hour, or sum()/<hours in the span>. If your chart span ends up being 30m, it is sum()*2.
If you want the span to be 1h, you still have to specify the argument span=1h in your search.
You can do per_hour() on one field and per_minute() (or any combination of the functions) on a different field in the same search.
Subsecond bin time spans
Subsecond span timescales, which are time spans that are made up of deciseconds (ds), centiseconds (cs), milliseconds (ms), or microseconds (us), should be numbers that divide evenly into a second. For example, 1s = 1000ms. This means that valid millisecond span values are 1, 2, 4, 5, 8, 10, 20, 25, 40, 50, 100, 125, 200, 250, or 500ms. In addition, span = 1000ms is not allowed. Use span = 1s instead.
Split-by fields
If you specify a split-by field, ensure that you specify the bins and span arguments before the split-by field. If you specify these arguments after the split-by field, Splunk software assumes that you want to control the bins on the split-by field, not on the time axis.
If you use chart or timechart, you cannot use a field that you specify in a function as your split-by field as well. For example, you will not be able to run:
... | chart sum(A) by A span=log2
However, you can work around this with an eval expression, for example:
... | eval A1=A | chart sum(A) by A1 span=log2
Prepending VALUE to the names of some fields that begin with underscore ( _ )
In timechart searches that include a split-by-clause, when search results include a field name that begins with a leading underscore ( _ ), Splunk software prepends the field name with VALUE and creates as many columns as there are unique entries in the argument of the BY clause. Prepending the string with VALUE distinguishes the field from internal fields and avoids naming a column with a leading underscore, which ensures that the field is not hidden in the output schema like most internal fields.
For example, consider the following search:
index="_internal" OR index="_audit" | timechart span=1m sum(linecount) by index
The results look something like this:
| _time | VALUE_audit | VALUE_internal |
|---|---|---|
| 2023-06-26 21:00:00 | 1 | 586 |
| 2023-06-26 21:01:00 | 1 | 295 |
| 2023-06-26 21:02:00 | 1 | 555 |
The columns are displayed in the search results as VALUE_audit and VALUE_internal.
Supported functions
You can use a wide range of functions with the timechart command. For general information about using functions, see Statistical and charting functions.
- For a list of functions by category, see Function list by category
- For an alphabetical list of functions, see Alphabetical list of functions
Functions and memory usage
Some functions are inherently more expensive, from a memory standpoint, than other functions. For example, the distinct_count function requires far more memory than the count function. The values and list functions also can consume a lot of memory.
If you are using the distinct_count function without a split-by field or with a low-cardinality split-by by field, consider replacing the distinct_count function with the the estdc function (estimated distinct count). The estdc function might result in significantly lower memory usage and run times.
Lexicographical order
Lexicographical order sorts items based on the values used to encode the items in computer memory. In Splunk software, this is almost always UTF-8 encoding, which is a superset of ASCII.
- Numbers are sorted before letters. Numbers are sorted based on the first digit. For example, the numbers 10, 9, 70, 100 are sorted lexicographically as 10, 100, 70, 9.
- Uppercase letters are sorted before lowercase letters.
- Symbols are not standard. Some symbols are sorted before numeric values. Other symbols are sorted before or after letters.
You can specify a custom sort order that overrides the lexicographical order. See the blog Order Up! Custom Sort Orders.
Basic Examples
1. Chart the product of the average "CPU" and average "MEM" for each "host"
For each minute, compute the product of the average "CPU" and average "MEM" for each "host".
... | timechart span=1m eval(avg(CPU) * avg(MEM)) BY host
2. Chart the average of cpu_seconds by processor
This example uses an eval expression that includes a statistical function, avg to calculate the average of cpu_seconds field, rounded to 2 decimal places. The results are organized by the values in the processor field. When you use a eval expression with the timechart command, you must also use BY clause.
... | timechart eval(round(avg(cpu_seconds),2)) BY processor
3. Chart the average of "CPU" for each "host"
For each minute, calculate the average value of "CPU" for each "host".
... | timechart span=1m avg(CPU) BY host
4. Chart the average "cpu_seconds" by "host" and remove outlier values
Calculate the average "cpu_seconds" by "host". Remove outlying values that might distort the timechart axis.
... | timechart avg(cpu_seconds) BY host | outlier action=tf
5. Chart the average "thruput" of hosts over time
... | timechart span=5m avg(thruput) BY host
6. Chart the eventypes by source_ip
For each minute, count the eventypes by source_ip, where the count is greater than 10.
sshd failed OR failure | timechart span=1m count(eventtype) BY source_ip usenull=f WHERE count>10
7. Align the chart time bins to local time
Align the time bins to 5am (local time). Set the span to 12h. The bins will represent 5am - 5pm, then 5pm - 5am (the next day), and so on.
...| timechart _time span=12h aligntime=@d+5h
8. In a multivalue BY field, remove duplicate values
For each unique value of mvfield, return the average value of field. Deduplicates the values in the mvfield.
...| timechart avg(field) BY mvfield dedup_splitval=true
9. Rename fields prepended with VALUE
To rename fields with leading underscores that are prepended with VALUE, add the following command to your search:
... | rename VALUE_* as *
The columns in your search results now display without the leading VALUE_ in the field name.
Extended Examples
1. Chart revenue for the different products
This example uses the sample dataset from the Search Tutorial and a field lookup to add more information to the event data. To try this example for yourself:
The tutorialdata.zip file includes a |
Chart the revenue for the different products that were purchased yesterday.
sourcetype=access_* action=purchase | timechart per_hour(price) by productName usenull=f useother=f
- This example searches for all purchase events (defined by the
action=purchase). - The results are piped into
timechartcommand. - The
per_hour()function sums up the values of thepricefield for eachproductNameand organizes the total by time.
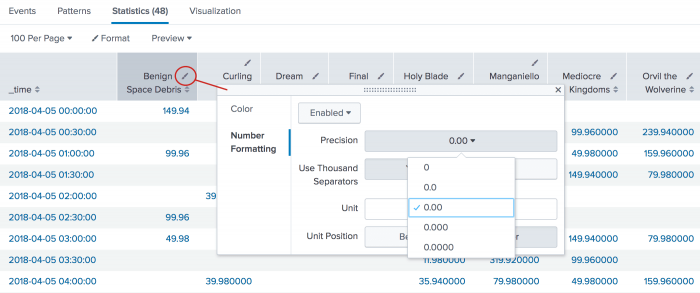
This search produces the following table of results in the Statistics tab. To format the numbers to the proper digits for currency, click the format icon in the column heading. On the Number Formatting tab, select the Precision.
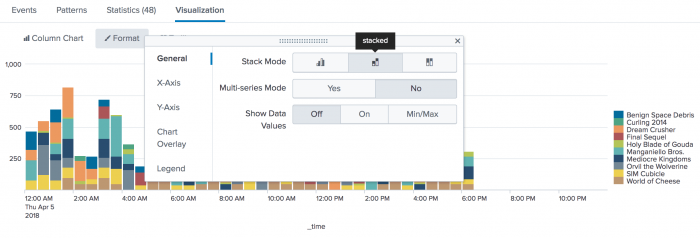
Click the Visualization tab. If necessary, change the chart to a column chart. On the Format menu, the General tab contains the Stack Mode option where you can change the chart to a stacked chart.
After you create this chart, you can position your mouse pointer over each section to view more metrics for the product purchased at that hour of the day.
Notice that the chart does not display the data in hourly spans. Because a span is not provided (such as span=1hr), the per_hour() function converts the value so that it is a sum per hours in the time range (which in this example is 24 hours).
2. Chart daily purchases by product type
| This example uses the sample data from the Search Tutorial. To try this example on your own Splunk instance, you must download the sample data and follow the instructions to get the tutorial data into Splunk. Use the time range All time when you run the search. |
Chart the number of purchases made daily for each type of product.
sourcetype=access_* action=purchase | timechart span=1d count by categoryId usenull=f
- This example searches for all purchases events, defined by the
action=purchase, and pipes those results into thetimechartcommand. - The
span=1dayargument buckets the count of purchases over the week into daily chunks. - The
usenull=fargument ignore any events that contain a NULL value forcategoryId.
The results appear on the Statistics tab and look something like this:
| _time | ACCESSORIES | ARCADE | SHOOTER | SIMULATION | SPORTS | STRATEGY | TEE |
|---|---|---|---|---|---|---|---|
| 2018-03-29 | 5 | 17 | 6 | 3 | 5 | 32 | 9 |
| 2018-03-30 | 62 | 63 | 39 | 30 | 22 | 127 | 56 |
| 2018-03-31 | 65 | 94 | 38 | 42 | 34 | 128 | 60 |
| 2018-04-01 | 54 | 82 | 42 | 39 | 13 | 115 | 66 |
| 2018-04-02 | 52 | 63 | 45 | 42 | 22 | 124 | 52 |
| 2018-04-03 | 46 | 76 | 34 | 42 | 19 | 123 | 59 |
| 2018-04-04 | 57 | 70 | 36 | 38 | 20 | 130 | 56 |
| 2018-04-05 | 46 | 72 | 35 | 37 | 13 | 106 | 46 |
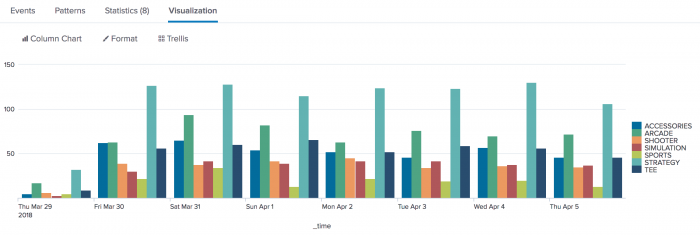
Click the Visualization tab. If necessary, change the chart to a column chart.
Compare the number of different items purchased each day and over the course of the week.
3. Display results in 1 week intervals
| This search uses recent earthquake data downloaded from the USGS Earthquakes website. The data is a comma separated ASCII text file that contains magnitude (mag), coordinates (latitude, longitude), region (place), etc., for each earthquake recorded.
You can download a current CSV file from the USGS Earthquake Feeds and upload the file to your Splunk instance. This example uses the All Earthquakes data from the past 30 days. |
This search counts the number of earthquakes in Alaska where the magnitude is greater than or equal to 3.5. The results are organized in spans of 1 week, where the week begins on Monday.
source=all_month.csv place=*alaska* mag>=3.5 | timechart span=w@w1 count BY mag
- The <by-clause> is used to group the earthquakes by magnitude.
- You can only use week spans with the snap-to span argument in the
timechartcommand. For more information, see Specify a snap to time unit.
The results appear on the Statistics tab and look something like this:
| _time | 3.5 | 3.6 | 3.7 | 3.8 | 4 | 4.1 | 4.1 | 4.3 | 4.4 | 4.5 | OTHER |
|---|---|---|---|---|---|---|---|---|---|---|---|
| 2018-03-26 | 3 | 3 | 2 | 2 | 3 | 1 | 0 | 2 | 1 | 1 | 1 |
| 2018-04-02 | 5 | 7 | 2 | 0 | 3 | 2 | 1 | 0 | 0 | 1 | 1 |
| 2018-04-09 | 2 | 3 | 1 | 2 | 0 | 2 | 1 | 1 | 0 | 1 | 2 |
| 2018-04-16 | 6 | 5 | 0 | 1 | 2 | 2 | 2 | 0 | 0 | 2 | 1 |
| 2018-04-23 | 2 | 0 | 0 | 0 | 0 | 2 | 1 | 2 | 2 | 0 | 1 |
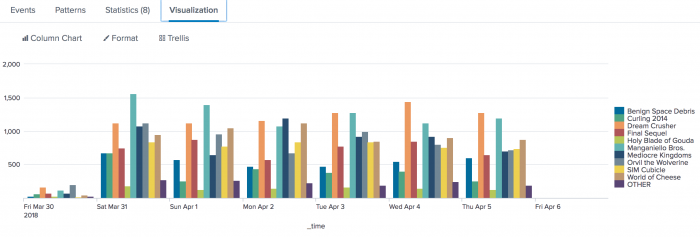
4. Count the revenue for each item over time
This example uses the sample dataset from the Search Tutorial and a field lookup to add more information to the event data. Before you run this example:
The original data set includes a |
Count the total revenue made for each item sold at the shop over the last 7 days. This example shows two different searches to generate the calculations.
- Search 1
- The first search uses the
spanargument to bucket the times of the search results into 1 day increments. The search then uses thesum()function to add thepricefor eachproduct_name. sourcetype=access_* action=purchase | timechart span=1d sum(price) by productName usenull=f
- Search 2
- This second search uses the
per_day()function to calculate the total of thepricevalues for each day. sourcetype=access_* action=purchase | timechart per_day(price) by productName usenull=f
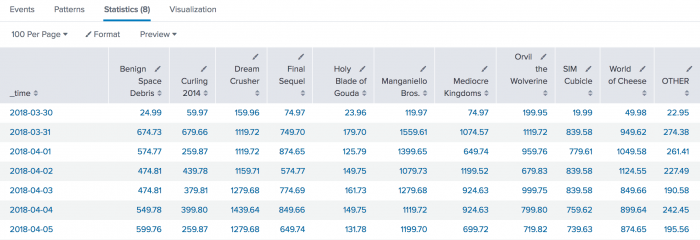
Both searches produce similar results. Search 1 produces values with two decimal places. Search 2 produces values with six decimal places. The following image shows the results from Search 1.
Click the Visualization tab. If necessary, change the chart to a column chart.
Now you can compare the total revenue made for items purchased each day and over the course of the week.
5. Chart product views and purchases for a single day
| This example uses the sample data from the Search Tutorial but should work with any format of Apache web access log. To try this example on your own Splunk instance, you must download the sample data and follow the instructions to get the tutorial data into Splunk. Use the time range Yesterday when you run the search. |
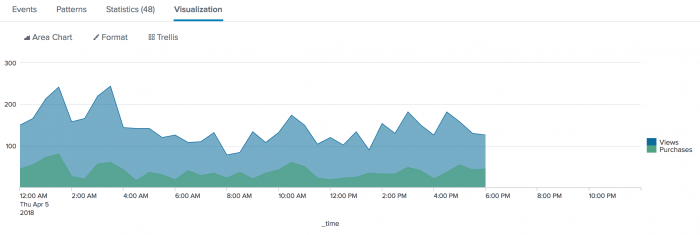
Chart a single day's views and purchases at the Buttercup Games online store.
sourcetype=access_* | timechart per_hour(eval(method="GET")) AS Views, per_hour(eval(action="purchase")) AS Purchases
- This search uses the
per_hour()function andevalexpressions to search for page views (method=GET) and purchases (action=purchase). - The results of the
evalexpressions are renamed asViewsandPurchases, respectively.
The results appear on the Statistics tab and look something like this:
| _time | Views | Purchases |
|---|---|---|
| 2018-04-05 00:00:00 | 150.000000 | 44.000000 |
| 2018-04-05 00:30:00 | 166.000000 | 54.000000 |
| 2018-04-05 01:00:00 | 214.000000 | 72.000000 |
| 2018-04-05 01:30:00 | 242.000000 | 80.000000 |
| 2018-04-05 02:00:00 | 158.000000 | 26.000000 |
| 2018-04-05 02:30:00 | 166.000000 | 20.000000 |
| 2018-04-05 03:00:00 | 220.000000 | 56.000000 |
Click the Visualization tab. Format the results as an area chart.
The difference between the two areas indicates that many of the views did not become to purchases. If all of the views became purchases, you would expect the areas to overlay on top each other completely. There would be no difference between the two areas.
Where clause examples
These examples use the where clause to control the number of series values returned in the time-series chart.
Example 1: Show the 5 most rare series based on the minimum count values. All other series values will be labeled as "other".
index=_internal | timechart span=1h count by source WHERE min in bottom5
Example 2: Show the 5 most frequent series based on the maximum values. All other series values will be labeled as "other".
index=_internal | timechart span=1h count by source WHERE max in top5
These two searches return six data series: the five top or bottom series specified and the series labeled other. To hide the "other" series, specify the argument useother=f.
Example 3: Show the source series count of INFO events, but only where the total number of events is larger than 100. All other series values will be labeled as "other".
index=_internal | timechart span=1h sum(eval(if(log_level=="INFO",1,0))) by source WHERE sum > 100
Example 4: Using the where clause with the count function measures the total number of events over the period. This yields results similar to using the sum function.
The following two searches returns the sources series with a total count of events greater than 100. All other series values will be labeled as "other".
index=_internal | timechart span=1h count by source WHERE count > 100
index=_internal | timechart span=1h count by source WHERE sum > 100
See also
- Commands
- bin
- chart
- sitimechart
- timewrap
| tail | timewrap |
This documentation applies to the following versions of Splunk Cloud Platform™: 9.3.2411, 8.2.2112, 8.2.2201, 8.2.2202, 8.2.2203, 9.0.2205, 9.0.2208, 9.0.2209, 9.0.2303, 9.0.2305, 9.1.2308, 9.1.2312, 9.2.2403, 9.2.2406, 9.3.2408 (latest FedRAMP release)
 Download manual
Feedback submitted, thanks!