Monitor your deployment with the splunkd health report
The splunkd health report is a REST-based monitoring tool that lets you view and investigate the health status of your deployment directly inside the Splunk Cloud Platform UI. Individual Splunk Cloud Platform features report their health status through a tree structure that provides a continuous, real-time view of the health of your service, with no impact on search loads or ingest latency.
By default, the splunkd health report in Splunk Cloud Platform lets the sc_admin role view the health status of Search Scheduler features only. See Supported features.
Access the splunkd health report
To access the splunkd health report:
- In Splunk Web, find the health report icon on the Splunk bar. The icon changes color from green to yellow or red, based on the health status of features in the health report.
- Select the health report icon to open the health report.
- In the health status tree, select any feature to view information about that feature's status.

How the splunkd health report works
The health report records the health status of Splunk Cloud Platform features in a tree structure, where leaf nodes represent particular features, and intermediary nodes categorize the various features. Feature health status is color-coded in four states as follows:
- Green: The feature is functioning properly.
- Yellow: The feature is experiencing a problem.
- Red: The feature has a severe issue and is negatively impacting the functionality of your deployment.
- Grey: Health report is disabled for the feature.
The health status tree structure
The health status tree has the following nodes:
| Health status tree node | Description |
|---|---|
| splunkd | The top level node of the status tree shows the overall health status (color) of splunkd. The status of splunkd shows the least healthy state present in the tree. The REST endpoint retrieves the instance health from the splunkd node.
|
| Feature categories | Feature categories represent the second level in the health status tree. Feature categories are logical groupings of features. For example, "Search Lag", "Searches Delayed", and "Searches Skipped" are features that form a logical grouping with the name "Search Scheduler". Feature categories act as buckets for groups and reflect the status of the least healthy feature within the category. For example, if the health status of the "Search Lag" feature is red, the "Search Scheduler" category displays red. |
| Features | The next level in the status tree is feature nodes. Each node contains information on the health status of a particular feature. Each feature contains one or more indicators that determine the status of the feature. The overall health status of a feature is based on the least healthy color of any of its indicators. |
| Indicators | Indicators are the fundamental elements of the splunkd health report. These are the lowest levels of functionality that are tracked by each feature, and change colors as functionality changes. Indicator values are measured against red or yellow threshold values to determine the status of the feature. See What determines the status of a feature?
|
What determines the health status of a feature?
The health status of a feature depends on the current value of its associated indicators. For example, the status of the Search Scheduler: Search Skipped feature depends on the following two indicators:
percent_searches_skipped_high_priority_last_24hpercent_searches_skipped_non_high_priority_last_24h
Each indicator has a configurable threshold for yellow and red. When an indicator's value meets the threshold condition, the feature's status changes from green to yellow or yellow to red.
For instructions on configuring indicator thresholds, see Edit feature indicator thresholds.
View the splunkd health report
The splunkd health report in Splunk Web provides two options for viewing the health status of your deployment: a local health report view and a distributed health report view.
Local health report view
The local health report view shows the health status of your deployment from the viewpoint of the local instance on which you are monitoring. The local health report is the default view.
Distributed health report view
The distributed health report view shows the health status of features across a distributed deployment. The distributed health report aggregates health status information from connected instances on a single central instance. In Splunk Cloud Platform, search heads and search head cluster members act as central instances. The distributed health report option appears only on central instances of a distributed deployment.
The distributed health report is enabled by default on all search heads and search head cluster members. You can disable individual features in either the local health report or distributed health report to prevent the feature from reporting health status information to the splunkd health status tree. For more information, see Disable a health report feature.
Configure the splunkd health report
The splunkd health report displays the status of a pre-defined set of Splunk Cloud Platform features. You can modify some health report settings, including feature indicator thresholds, using the health report manager page in Splunk Web.
Supported features
The splunkd health report lets the sc_admin role monitor these features by default:
| Feature Category | Features |
|---|---|
| Search Scheduler | Searches Skipped, Searches Delayed, Search Lag |
To view and edit thresholds for Search Scheduler features in the splunkd health report, a role must have the list_health_subset and edit_health_subsetcapabilities. The sc_admin role has these capabilities by default.
For information on additional health report features, see Supported features in the Monitoring Splunk Enterprise manual.
Edit feature indicator thresholds
Each feature in the health status tree has one or more indicators. Each indicator reports a value against a pre-set threshold, which determines the status of the feature. When the indicator value meets the threshold condition, the health status of the feature changes, for example, from green to yellow, or yellow to red. Changing threshold values for any feature applies to all associated search heads or search head cluster members.
You can edit the threshold value for any feature indicator using Splunk Web, as follows:
- In Splunk Web, select Setttings > Health report manager.
- Find the feature you want to modify and select Edit Thresholds.
The Edit Threshold modal opens showing a detailed description of each feature indicator. - Set new indicator threshold values. For example, to modify thresholds for the Search Scheduler: Searches Skipped feature, you can set new Red or Yellow threshold values for the
percent_searches_skipped_high_priority_last_24handpercent_searches_skipped_non_high_priority_last_24hindicators:
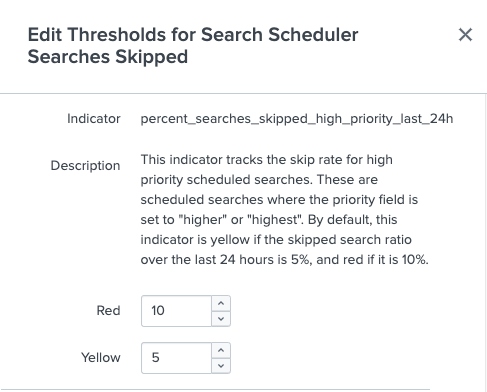
- Select Save.

Disable a health report feature
You can disable any feature in the local or distributed health report using Splunk Web. Disabling a feature stops the feature from reporting health status information to the splunkd health status tree, which can be useful for removing noisy or irrelevant features from the health report view.
To disable a feature in the local health report using Splunk Web:
- Log in to the local instance on which you want to disable the feature.
- In Splunk Web, select Settings > Health report manager.
- Find the feature you want to disable and select Edit.
- In the modal, set the Include in local report switch to Enabled or Disabled.
The feature is disabled and no longer impacts the overall health status ofsplunkd. The feature now appears greyed out in the local health report.
To disable a feature in the the distributed health report using Splunk Web:
- Log in to the central instance of the distributed health report, such as the cluster manager, search head, or search head cluster.
- In Splunk Web, select Settings > Health report manager.
- Find the feature you want to disable, and select Edit.
- In the modal, set the Include in distributed report switch to Enabled or Disabled.
The feature is disabled and no longer impacts the overall health status ofsplunkd. The feature now appears greyed out in the distributed health report.
To temporarily disable alerts for a feature, select Snooze and specify a time duration. At the end of the specified duration alerts for the feature are re-enabled.
Example: Investigate search scheduler health status changes
The splunkd health report lets you view the current health status of Search Scheduler features, including Searches Skipped, Searches Delayed, and Search Lag. You can use the report to identify and investigate Search Scheduler issues that can impact search performance.
The following example shows how you can use the splunkd health report to investigate Search Scheduler health status changes.
1. Check the health report status
- In Splunk Web, check the color of the health report icon in the main menu. A red or yellow icon indicates that one or more search scheduler features have a problem.
- Select the health report icon to open the health report. The following health report indicates that the Skipped Searches feature has a severe problem, and that the Search Lag feature might also have a problem.
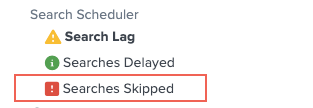

- Select the Searches Skipped feature to view diagnostic information about the current health status of the feature.
- Review the information under Root Cause. In this case, the percentage of high priority searches skipped is 44% over the last 24 hours, which exceeds the red threshold of 10% and causes the feature's health status to change to red.
- Review the Last 50 related messages. These log entries include warning messages showing that some scheduled searches cannot be executed. For example:
09-15-2020 16:11:00.324 +0000 WARN SavedSplunker - cannot execute scheduled searches that live at the system level (need an app context).
Among explanations for this type of warning message is the possibility that the number of high-priority searches running exceeds the maximum concurrent search limit, which can cause searches to be skipped.
3. Confirm the cause of feature status change
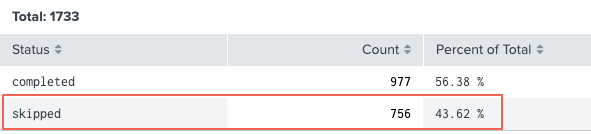
After you review root cause and log file information, which suggest that maximum search concurrency limits caused the Searches Skipped feature's status change, you can use the Cloud Monitoring Console to check search scheduler activity and confirm if the suspected cause is correct.
- In Splunk Web, select Apps > Cloud Monitoring Console.
- Select Search > Scheduler Activity.
The Count of Scheduler Executions panel shows that 43.62 % of searches have been skipped over the last 4 hours, which approximates the percentage of skipped searches reported under root cause in the health report.
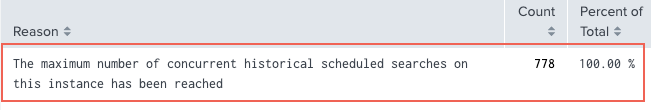
- Select Search > Skipped Scheduled Searches.
The Count of Skipped Scheduled Searches panel shows that 756 searches have been skipped over the last 4 hours because "The Maximum number of concurrent historical searches on this instance has been reached." This confirms that the cause of theSkipped Searchesstatus change is that the maximum concurrent search limit has been reached on the system.
- You can now take steps to remedy this issue, by decreasing the total number of concurrent scheduled searches running, and increasing the relative concurrency limit for scheduled searches, which can bring the number of concurrent searches below the maximum concurrent search limit, and return the Searches Skipped feature to the green state.
For information on relative concurrency limits for scheduled searches, see Set limits for concurrent scheduled searches.


| Use the Workload Management Monitoring dashboard | Use the Ingest Processor dashboard |
This documentation applies to the following versions of Splunk Cloud Platform™: 9.0.2303, 9.0.2305, 9.1.2308, 9.1.2312, 9.2.2403, 9.2.2406, 9.3.2408, 9.3.2411 (latest FedRAMP release)
Feedback submitted, thanks!