Dashboards
Splunk App for Stream provides pre-built dashboards that let you monitor:
- Network interface metrics.
- Stream Forwarder (
streamfwd) process metrics. - Stream Stats Only mode.
- Stream Forwarder log data.
- SSL Activity.
Use these dashboards to identify spikes and trends in network activity that can indicate an issue with your network and help you analyze customer behavior.
Click on any point in a dashboard graph to drill down to the underlying Splunk search results, and perform additional search and analysis across your network and log data.
Network Metrics
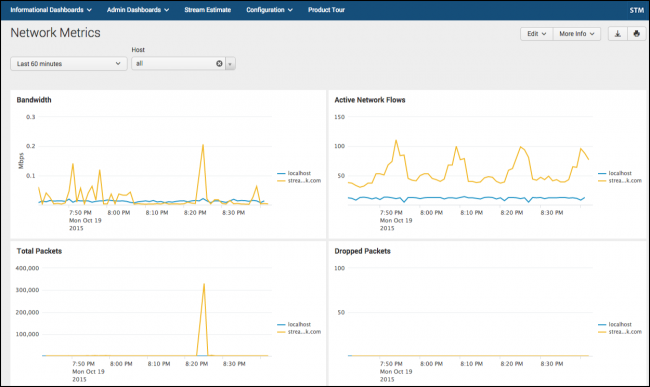
The Network Metrics dashboard lets you monitor these network events:
- Bandwidth (Mbps)
- Active Network Flows
- Total Packets
- Dropped Packets
To open the Network Metrics dashboard:
1. In Splunk Web, select Apps > Splunk App for Stream. This opens the Streams Config page.
2. Select Dashboards > Network Metrics. The Network Metrics dashboard appears.
Stream Forwarder Metrics
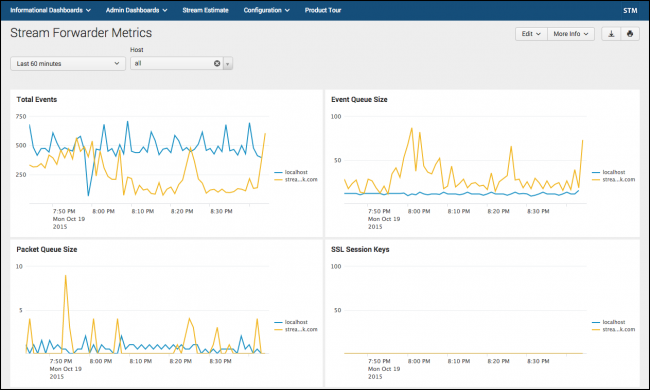
The Stream Forwarder Metrics dashboard lets you monitor these streamfwd binary process metrics:
- Packet Queue Size
- SSL Session Key Count
- TCP Session Count
- TCP Reassembly Packet Count
- TCP Reassembly Payload Size
To open the Stream Forwarder Metrics dashboard:
1. In Splunk Web, select Apps > Splunk App for Stream. This opens the Streams Config page.
2. Select Dashboards > Stream Forwarder Metrics. The Network Metrics dashboard appears.
Stream Stats
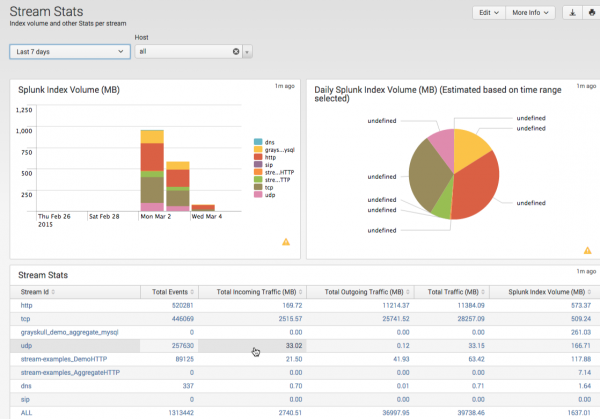
The Stream Stats dashboard displays index volume and traffic throughput stats for stream protocols in the Stats Only mode. You can use this dashboard to view the the total amount of data that Stream captures over time for each protocol. The Stream Stats dashboard displays stats for tcp and udp protocols by default.
To access the Stream Stats dashboard:
- In the Splunk App for Stream main menu, go to Dashboards > Stream Stats.
Stream Forwarder Logs
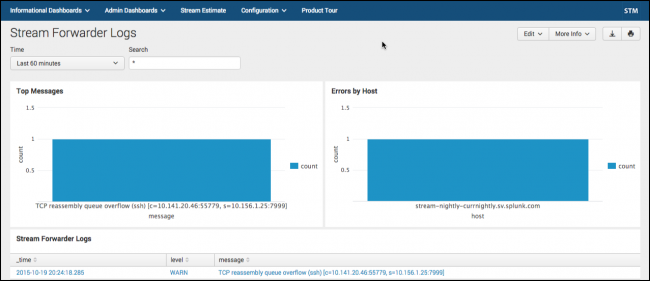
The Stream Forwarder Logs dashboard let you monitor log entries in the streamfwd.log file. The dashboard provides graphs of Top Messages and Errors by Host, along with a time-based listing of log messages that can help you quickly identify issues with network activities.
To open the Stream Forwarder Logs dashboard:
1. In Splunk Web, select Apps > Splunk App for Stream. This opens the Streams Config page.
2. Select Dashboards > Stream Forwarder Logs. The Stream Forwarder Logs dashboard appears.
| Distributed Forwarder Management | streamfwd command line options |
This documentation applies to the following versions of Splunk Stream™: 6.3.0, 6.3.1, 6.3.2


 Download manual
Feedback submitted, thanks!