Stream Informational Dashboards
Splunk App for Stream (splunk_app_stream) provides a set of built-in informational dashboards, which give you a quick overview of activities taking place across your network. Informational dashboards include:
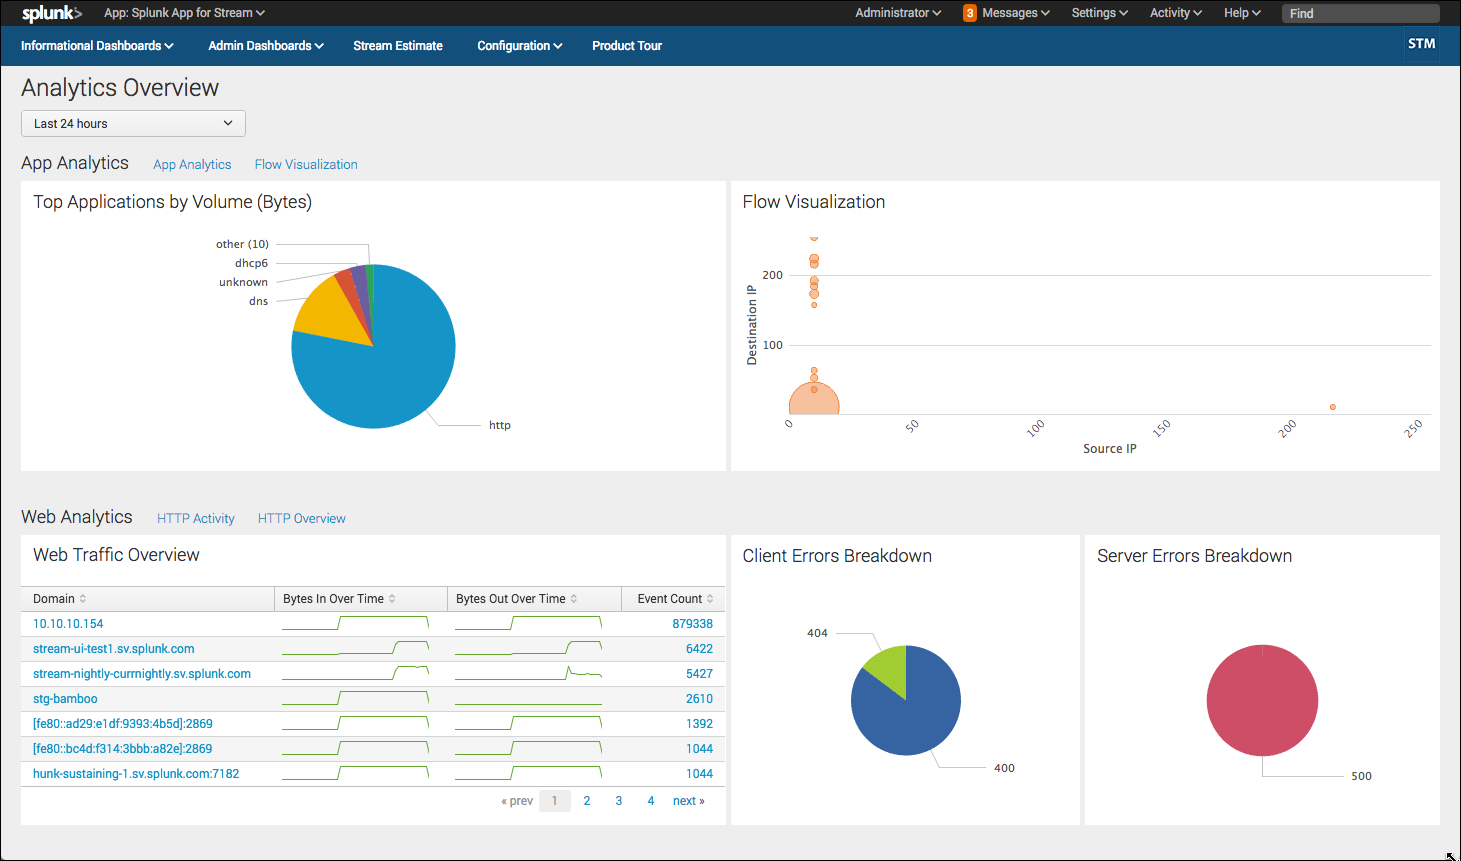
- Analytics Overview
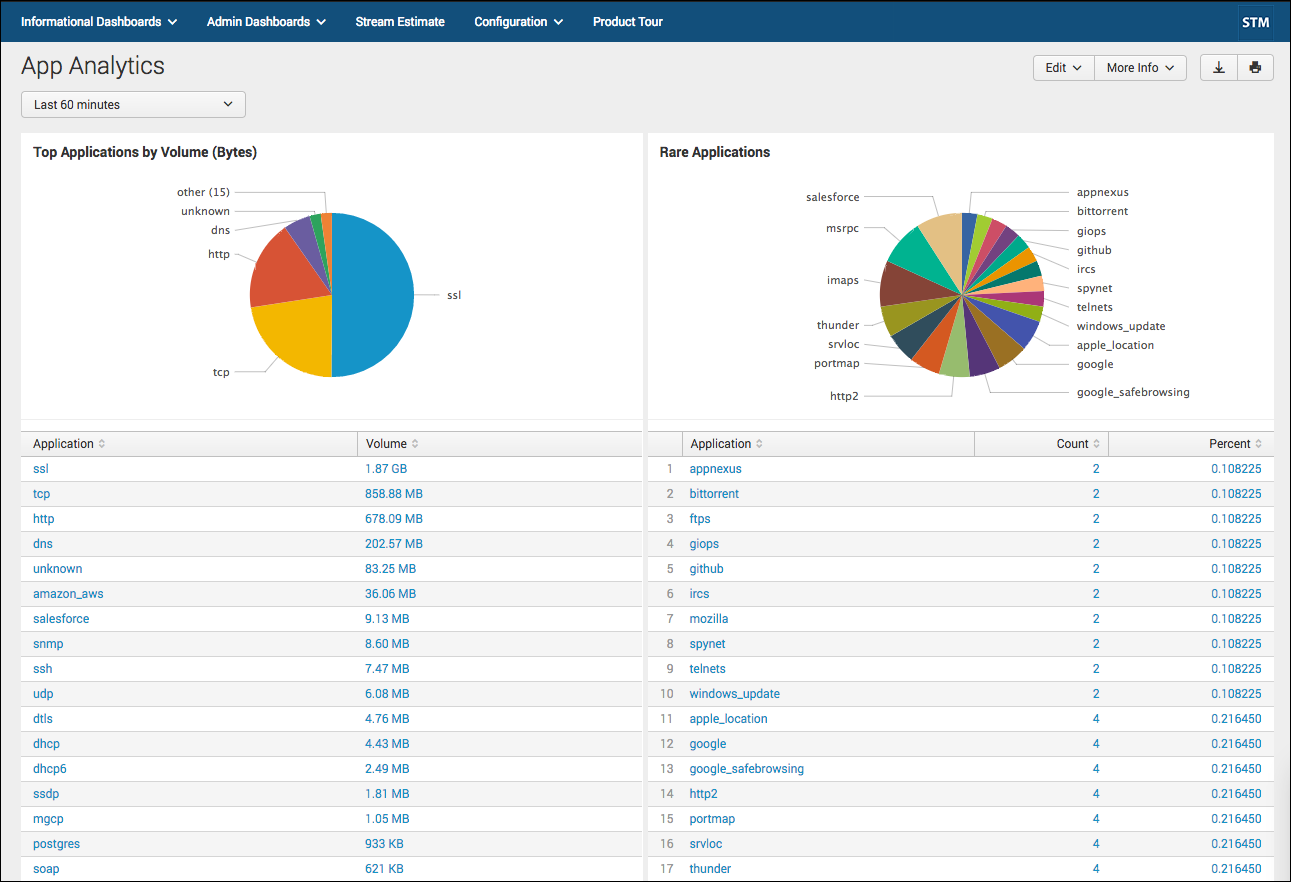
- App Analytics
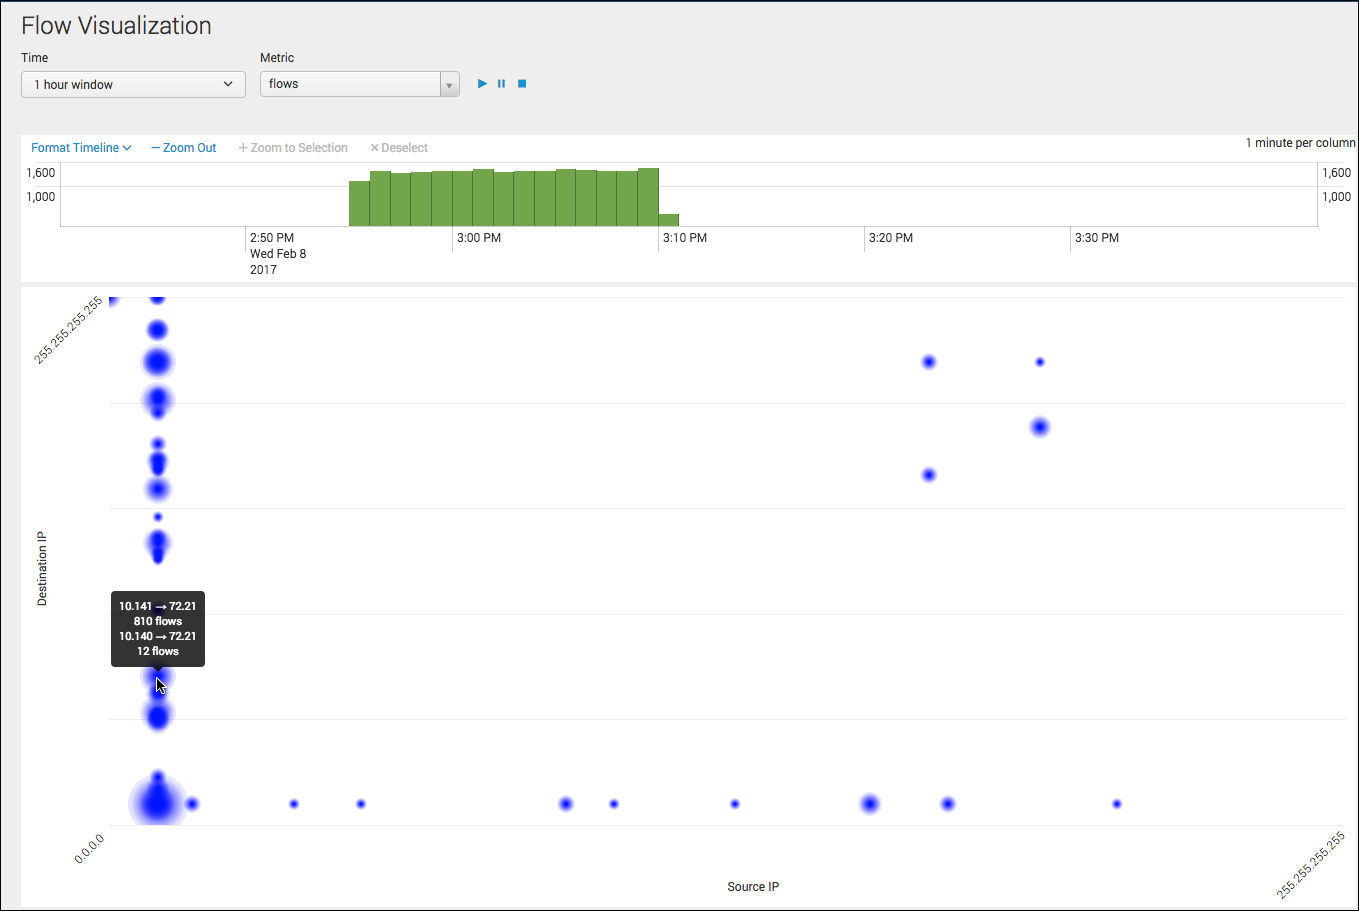
- Flow Visualization
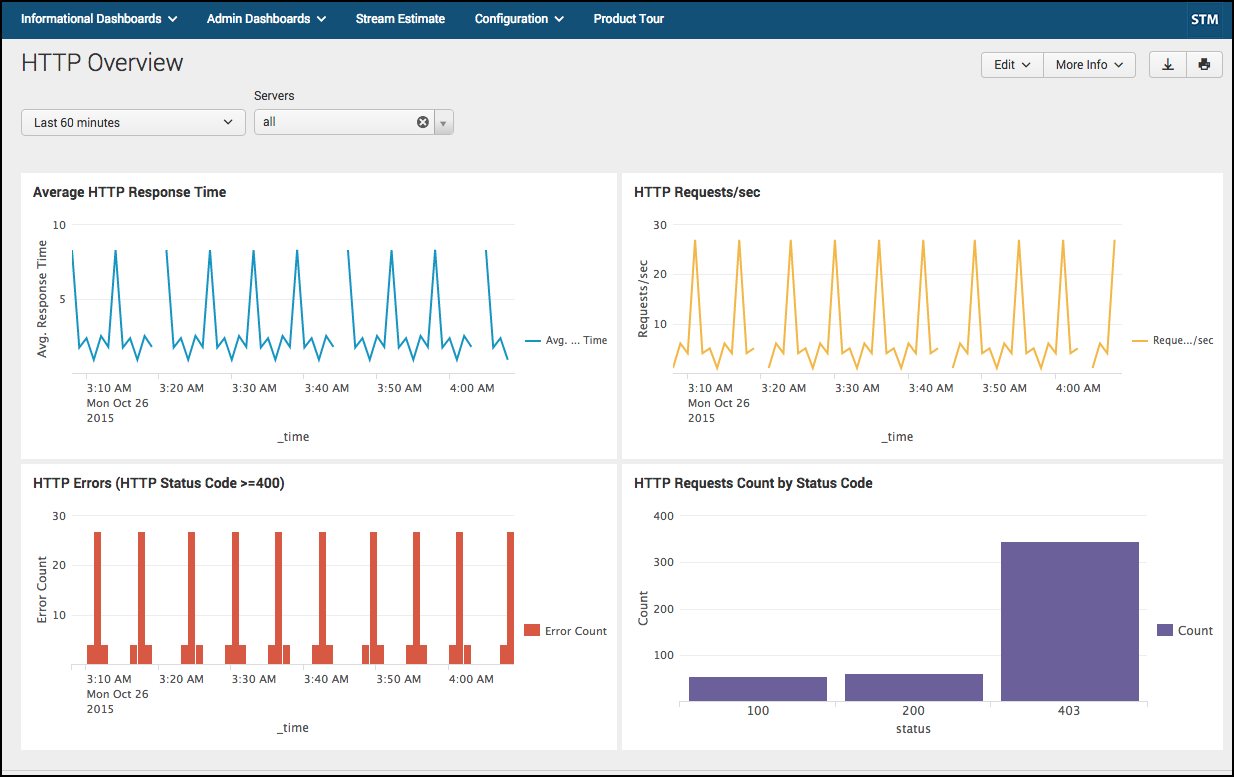
- HTTP Overview
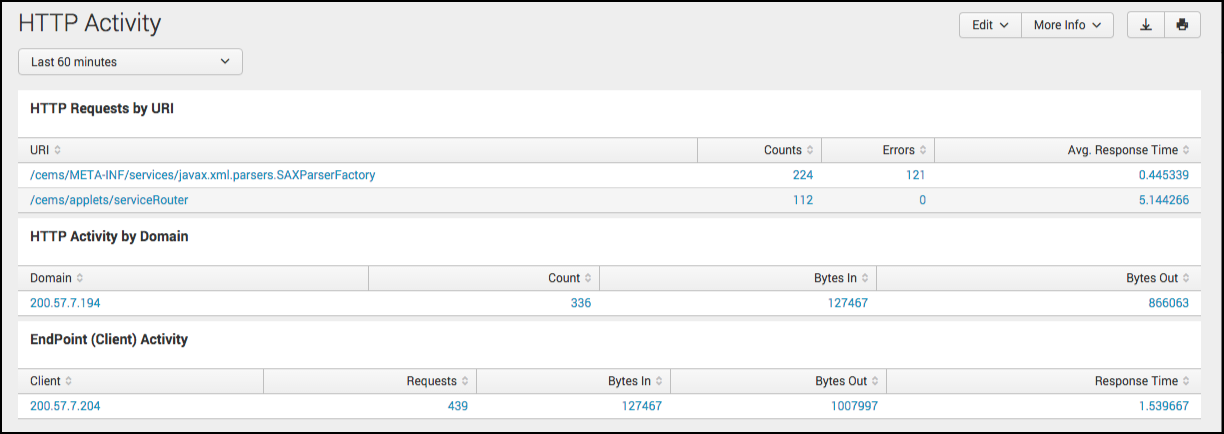
- HTTP Activity
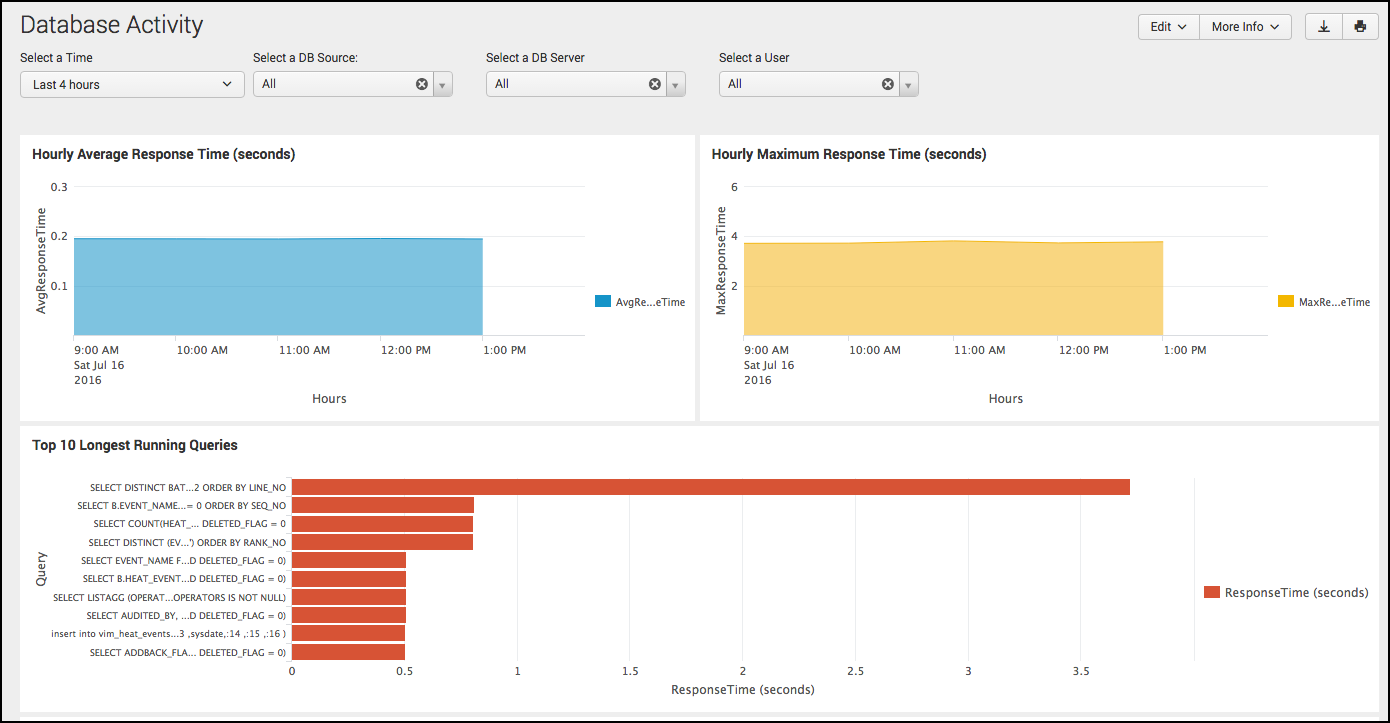
- Database Activity
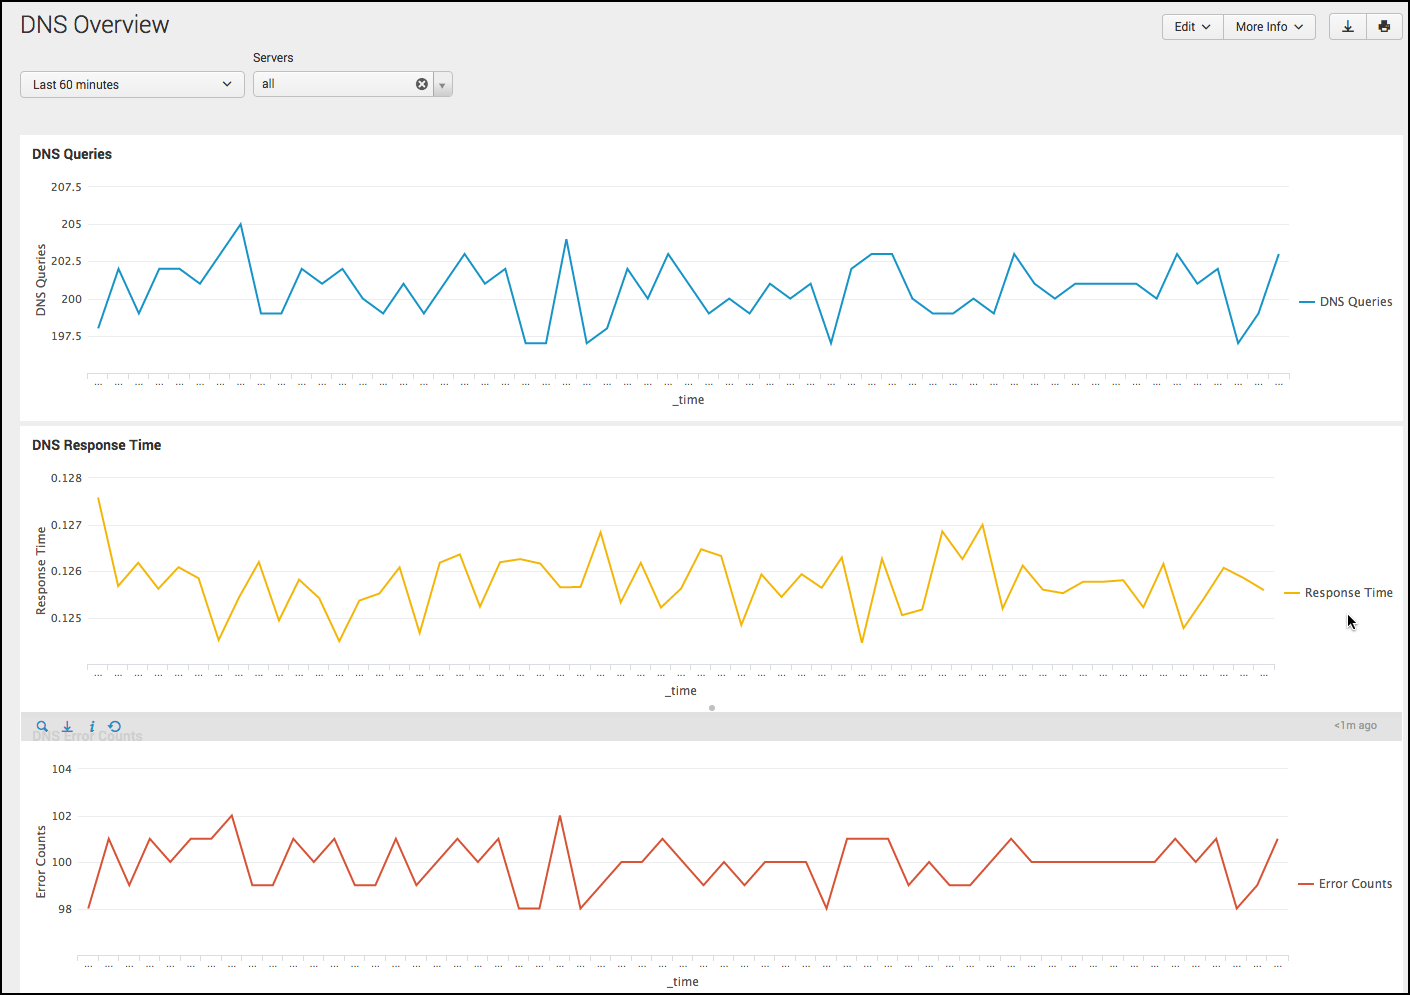
- DNS Overview
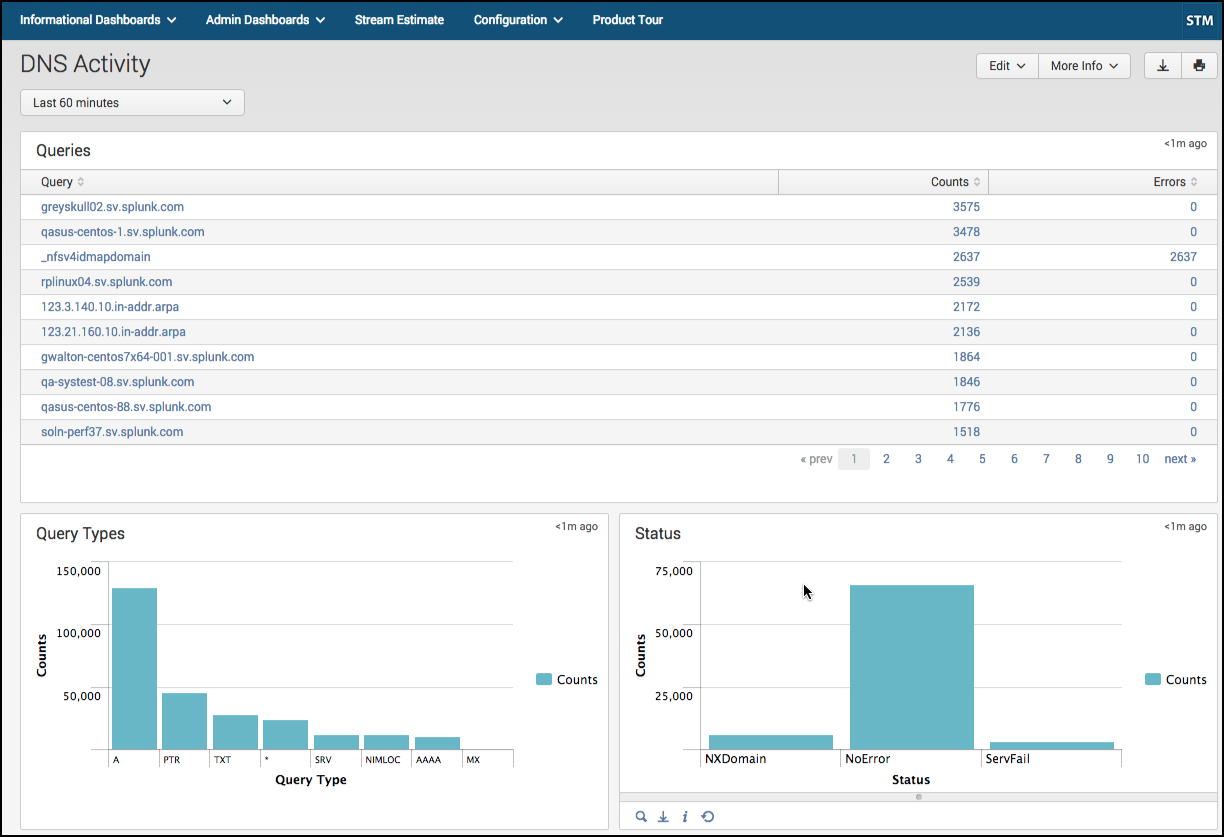
- DNS Activity
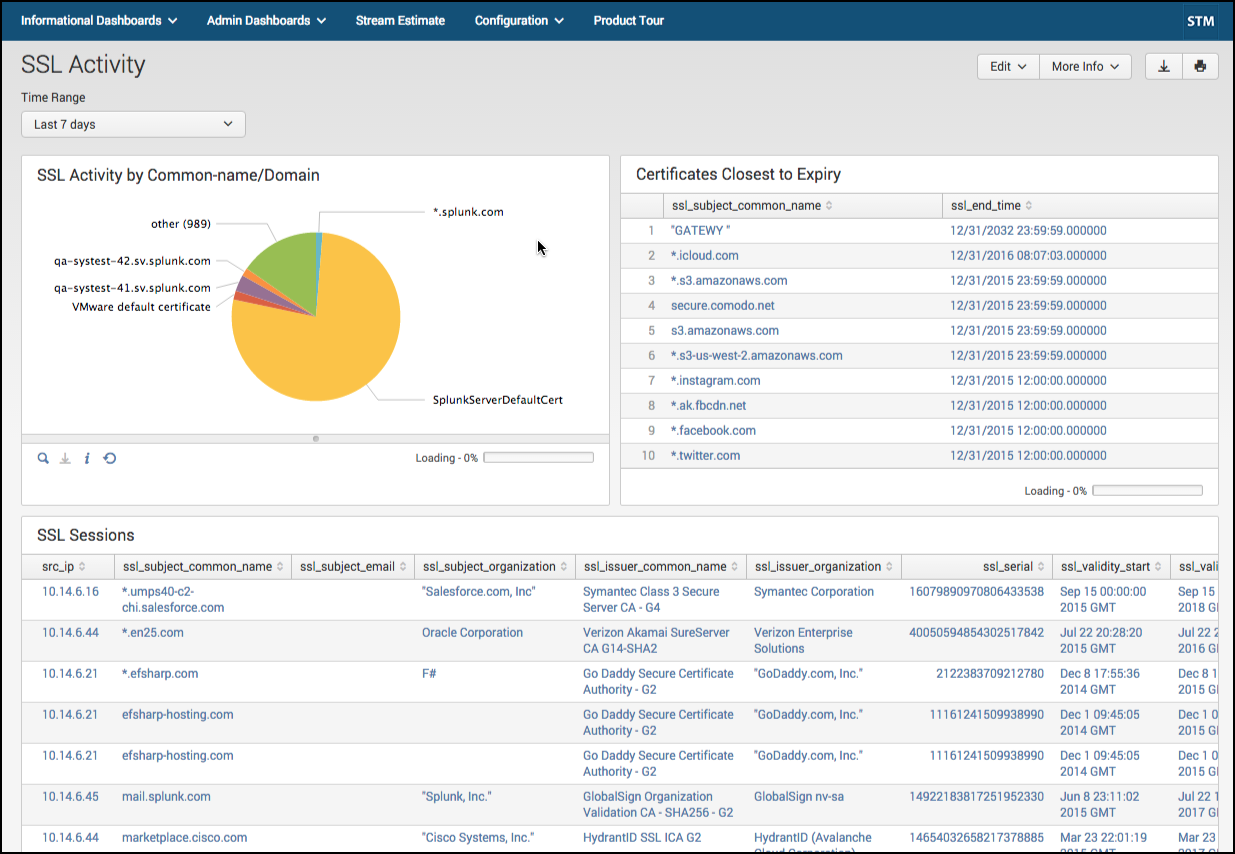
- SSL Activity
Informational dashboards are populated by a set of built-in streams that come with the app. Clone built-in streams and use them as a starting point to create your own new streams in the Configure Streams UI. For more information, see Configure Streams in this manual.
Impact of new aggregation methods on dashboards
As of version 6.6.0, the Database Activity dashboard and built-in Splunk database streams, such as Splunk_Mysql and Splunk_Postgres, have been updated to use the max(time_taken) aggregate function to generate max query time statistics. As a result, the Database Activity dashboard in version 6.6.0 and later is not compatible with data generated by earlier versions of streamfwd.
All other dashboards have been updated for the new aggregation methods introduced in version 6.6.0 and are compatible with data generated by both old and new versions of streamfwd. For more information, see Stream aggregation methods in this manual.
Analytics Overview
App Analytics
Flow Visualization
HTTP Overview
HTTP Activity
Database Activity
DNS Overview
DNS Activity
SSL Activity
| Use Stream Estimate to preview index volume | Stream Admin dashboards |
This documentation applies to the following versions of Splunk Stream™: 7.1.2, 7.1.3, 7.2.0
 Download manual
Feedback submitted, thanks!