Visualization components
Learn how to interpret timeline components.
Visual elements
Timelines show events and intervals for each resource.
Lanes
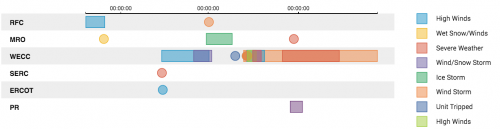
- Each lane in a timeline represents one resource in the set you are monitoring.

Intervals
- Horizontal bars or squares in a lane represent activity intervals.
- Events and intervals might overlap each other in a lane.

Events
- Circles in a lane represent discrete events.
- Events and intervals might overlap each other in a lane.

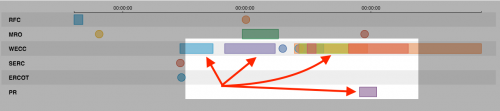
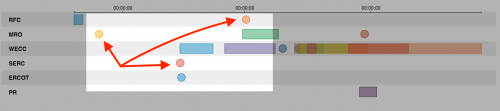
Interactive elements
Drilldown
Click on an event or interval in the visualization to open a separate search. The new search looks for events matching the time or interval that the clicked element represents.
Tooltips
Hover over an event or interval to show a tooltip with details about it.
Last modified on 12 August, 2016
| Create a timeline query | Customize a timeline |
This documentation applies to the following versions of Timeline (EOL): 1.0.0, 1.0.1, 1.1.0, 1.2.0, 1.3.0, 1.4.0, 1.5.0, 1.6.0, 1.6.1, 1.6.2
Feedback submitted, thanks!