Treemap components
Learn how to interpret treemap components.
Visual elements
Rectangle hierarchy
Treemap rectangles represent parent and child categories. This treemap has multiple parent and child rectangles.
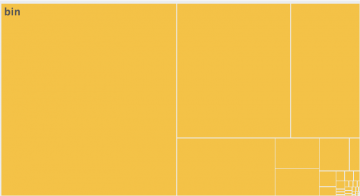
Each rectangle in a treemap represents a parent category. For example, here is the bin parent category from the treemap.
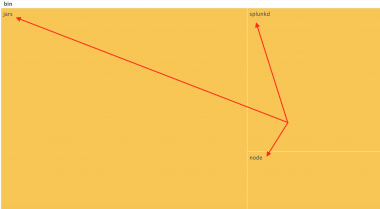
Every parent rectangle is made up of child rectangles. In this example, the bin parent category includes jars, splunkd, and node child categories.
Rectangle size
Rectangle size shows the relative importance of a particular parent or child category. You can use rectangle size to see how an aggregated metric, such as a yearly budget, breaks down into parent and child categories.
Color
Treemaps can use one of the following color modes.
Categorical
Each rectangle appears in a different color based on parent_category values.
Sequential
Rectangles appear in different shades on a spectrum between a minimum and maximum color. color_field values in the data determine the particular shade for a rectangle.
No color mode
If no color mode is used, the diagram shows all rectangles in a single color.
Interactive elements
Click a rectangle in a treemap to get more information.
Tooltips
Hover on a rectangle to see a tooltip with details about the category.
Drilldown
Click on a child rectangle to open a search using the child category values.
Zoom
Click on a parent rectangle to zoom in on the parent category and its child categories.
| Create a treemap query | Customize a treemap |
This documentation applies to the following versions of Treemap (EOL): 1.0.0, 1.0.1, 1.1.0, 1.1.1, 1.2.0, 1.3.0, 1.4.0, 1.5.0


 Download manual
Feedback submitted, thanks!