Examine Splunk UBA system health with the Splunk UBA Monitoring App
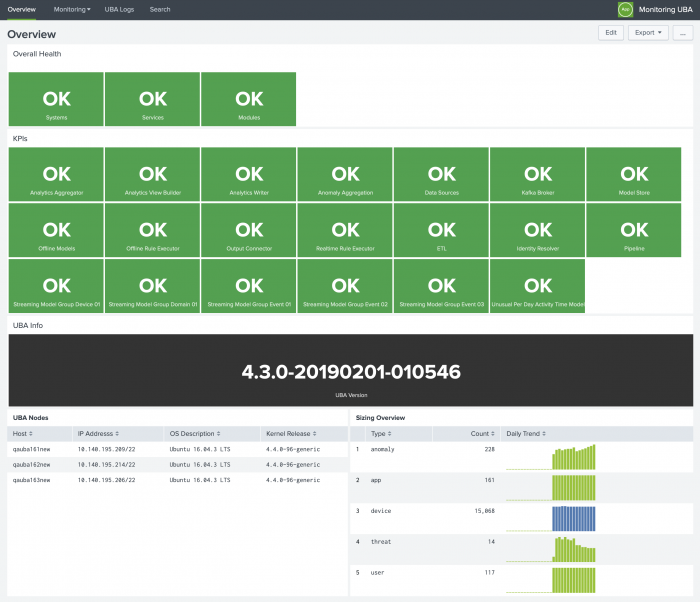
In Splunk Web, click Apps > Monitoring UBA to view the home page of the Splunk UBA Monitoring App:
The following table summarizes the panels you see on the home page:
| Panel | Description |
|---|---|
| Overall Health | A summary of the overall health of your Splunk UBA system, services, and modules. Possible statuses are OK, WARN, or BAD. |
| KPIs | A summary of the key performance indicators (KPIs) for important Splunk UBA components such as data sources, output connectors, and streaming models. Possible statuses are OK, WARN, or BAD. |
| UBA Info | The version of Splunk UBA that is running. |
| UBA Nodes | System information such as IP address, OS information and kernel version for each Splunk UBA node. The OS and kernel version must match on all Splunk UBA nodes, so this is a good way to quickly verify this information if you need to troubleshoot any issues. |
| Sizing Overview | A summary of sizing information including counts for the number of anomalies, applications, devices, users, and threats found in Splunk UBA. The information is presented as a daily trend so you can quickly see if there is a sudden increase in anomalies, for example, or a steady increase in the number of threats. |
CPU usage spikes
CPU utilization is likely to vary throughout the day, but can be especially high during nightly batch or offline model processing. If your observed spike aligns with your nightly batch or offline model processing schedule, and you observe no other indicators such as errors in logs or model failure, you can consider your spike normal.
Adhere to the guidelines in Scaling your Splunk UBA deployment when considering deployment sizing and events per second (EPS) capacity. Exceeding the specified EPS limits can impact CPU usage. To ensure EPS does not exceed the limits, you must monitor the health check logs.
| Send all logs to the Splunk platform | Example: Troubleshoot a data source |
This documentation applies to the following versions of Splunk® User Behavior Analytics Monitoring App: 1.0.0, 1.1, 1.1.1, 1.1.2, 1.1.3, 1.1.4

 Download manual
Feedback submitted, thanks!