Configure the Splunk App for Unix and Linux
This topic explains what happens when you activate the app after installing it on your Splunk instance. It shows you how to enable or disable the inputs that come with the add-on, and can be used as a reference.
To use data and scripted inputs, you must install and use the Splunk Add-on for Unix and Linux. To learn more about how to enable inputs in the Splunk Add-on for Unix and Linux, read "Enable data and scripted inputs for the Splunk Add-on for Unix and Linux" in the Splunk Add-on for Unix and Linux documentation.
Important: It's best practice to configure the data and scripted inputs and ensure that data collection is happening on this page before configuring the app.
Initial setup

Click for a larger image
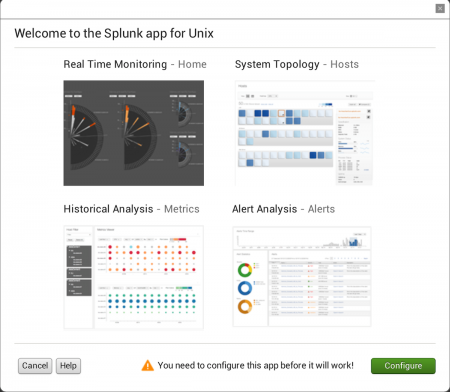
After you install the app and log into Splunk Web, when you activate the app, it presents you with a dialog box that states that you need to configure the app before you can use it.
You can click Cancel to exit this setup dialog. You can then return to it later by clicking the Settings link in the navigation bar within the app.
To set up the app, click the Configure button in the lower-right hand corner of the dialog box.
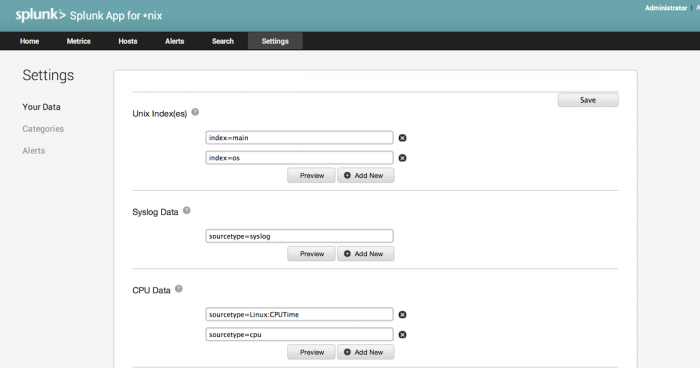
The Settings - Your Data screen loads.
Configure the Splunk App for Unix and Linux in Splunk Web
Settings: Your Data
This panel of the Settings menu allows you to configure which indexe(s) contain the data that the Splunk App for Unix and Linux uses, as well as the source types that the app should use to organize the various kinds of data it collects.
To change the indexes and/or source types that the Splunk App for Unix and Linux uses:
1. Follow the instructions in "Change Unix indexes" and / or "Change data source types" below.
2. After you have made changes to the fields in this panel, click the Save button to save your changes.
Note: If you have installed this app for the first time, you should not need to make changes to these settings. If you have upgraded from an earlier version and used different indexes and/or source types for your *nix data, you can use this panel to change the index(es) and source types as needed to point the Splunk App for Unix and Linux at your existing indexed *nix data.
Change Unix Indexes
The Unix Indexes field allows you to specify the index(es) that the Splunk App for Unix and Linux should use for access to *nix data it has collected.
To specify additional indexes:
1. Click the + Add New button. A new field appears.
2. In this new field, type in:
where index is an existing index defined on the Splunk instance that hosts the Splunk App for Unix and Linux, and which contains data collected by either the Splunk App or Splunk Add-on for Unix and Linux.
Repeat these steps for additional indexes.
To remove an existing defined index, click the x on the right side of the index field.
To confirm that the indexes you have specified contain the *nix data you want the Splunk App for Unix and Linux to use, click the Preview button. A new Search page opens that displays the most recent events collected for the specified indexes.
Change data source types
The remainder of the Your Data settings panel consists of fields which specify the source types for the various kinds of data that the Splunk App for Unix and Linux uses.
To specify additional source types under each Data field:
1. Click the + Add New button. A new field appears.
2. In this new field, type in:
where sourcetype is an existing source type defined on the Splunk instance that hosts the Splunk App for Unix and Linux.
Repeat these steps for additional source types.
To remove an existing defined source type, click the x on the right side of the source type field.
To confirm that the source types you have specified reference the *nix data you want the Splunk App for Unix and Linux to use, click the Preview button. A new Search page opens that displays the most recent events collected under the specified source types.
Settings: Categories
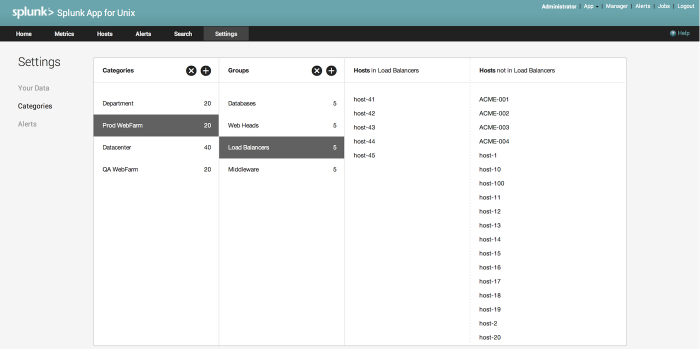
The Settings: Categories page allows you to define categories and groups for the hosts which the Splunk App for Unix and Linux has collected data for. Categories and groups allow you to easily compare metrics across different host types and/or roles when troubleshooting an issue. They also allow for ease of management when dealing with a large number of hosts.
The panel has four panes: Categories, Groups, Hosts in, and Hosts not in.
- The Categories panel represents the top-level grouping mechanism. You can use this panel to define site locations, like cities or data centers, for example.
- The Groups panel represents the second-level grouping mechanism. You can use this panel to define host or service groups, as an example.
- The Hosts in panel contains hosts which have been assigned to the current Category and Group. The Splunk App for Unix and Linux populates this list from the data you have collected with it.
- The Hosts not in panel contains hosts which have not been assigned to the active Category and Group. The Splunk App for Unix and Linux populates this list from the data you have collected with it.
Note: When you first run the Splunk App for Unix and Linux, it performs a search through the os index for host entries. It then creates a special category called "all_hosts" and a special group called "Default". The 50 most recent hosts it finds become a member of this special category and group until you define additional categories and groups.
Add new categories and groups
Use the Settings: Categories page to add host categories and groups. When you make these changes, the Splunk App for Unix and Linux writes them to $SPLUNK_HOME/etc/apps/splunk_app_for_nix/lookups/dropdowns.csv.
Important: If the Splunk App for Unix and Linux can't find any hosts, it creates a default 'all_hosts' group and 'Default' group and sets the host value to '*', which the app treats as a wild-card. If you want to create your own categories and groups, you must delete this default category and group first.
To create a category:
1. In the Categories pane, click the + sign.
Splunk adds a new category called New Category in the list.
2. Double-click on the new entry to rename it to whatever you desire.
Splunk highlights the text field to allow you to change the category's name.
3. When you are done renaming the category, click away from the highlighted text box to save the changes.
To create a group within a category:
1. Select the parent category what you wish to add a group to.
2. In the Groups pane, click the + sign.
Splunk adds a new category called New Group in the list.
3. Double-click on the new entry to rename it to whatever you desire.
Splunk highlights the text field to allow you to change the group's name.
4. When you are done renaming the group, click away from the highlighted text box to save the changes.
Important: You must add at least one host to a group in order for the Splunk App for Unix and Linux to save the group and the group's parent category. The app does not save empty categories and/or groups.
Remove groups and categories
To remove categories and groups, click once on the category or group you want to remove, then click the X button in the corresponding Category or Group column header. Splunk immediately deletes the selected category or group.
Note: If you choose to remove a category that has groups under it, Splunk also removes the groups that the category contains.
Add hosts to or remove hosts from a group
Once you have created the categories and groups you want, you can then assign hosts to a specific group.
When making host assignments, note the following:
- You can only assign hosts to a group. When you do this, the Splunk App for Unix and Linux automatically assigns the hosts to the category that contains the group.
- You can assign hosts to more than one group at a time. However, each group must be a member of a separate category.
- You cannot assign hosts to categories directly.
To assign a host to a group:
1. Click the group that you want to assign hosts to.
2. The Hosts in and Hosts not in columns populate with available hosts that the Splunk App for Unix and Linux has collected data for.
Note: New groups will not have hosts in the Hosts in column.
3. Locate the host that you want to add to the group in the Hosts not in column.
Note: If a host is already a member of another group, the Splunk App for Unix and Linux displays that group alongside the host name.
4. Drag the host from the Hosts not in column to the Hosts in column.
Splunk makes changes to the group based on the following factors:
- If the host is not already a member of another group within the currently selected category, Splunk adds the host to the new group and then immediately saves the change.
- If the host is a member of another group within the currently selected category, Splunk removes the host from the old group, adds it to the new group, and then immediately saves the change.
To remove a host from a group:
1. Click the group that you want to remove hosts from.
2. The Hosts in column populates with the hosts that have already been assigned to the group. The Hosts not in column populates with available hosts that the Splunk App for Unix and Linux has collected data for.
3. Locate the host that you want to remove from the group in the Hosts in column.
4. Drag the host from the Hosts in column to the Hosts not in column.
Splunk removes the host from the group and saves the change immediately.
Settings: Alerts
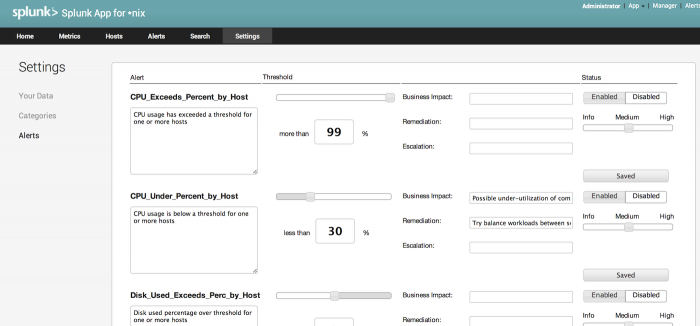
The Settings:Alerts page allows you to customize the alerts that the Splunk App for Unix and Linux displays when certain conditions trigger those alerts.
The Alerts settings page splits into three sections for each available alert:
- The Alert section, which shows the name of the alert, as well as a text box which allows you to enter a description for the alert.
- The Threshold section, which lets you specify when the alert triggers, as well as:
- The business impact of the alert.
- The remediation strategy - what a person who sees this alert should do to resolve it.
- The escalation path - who (or what) the alert should be escalated to if attempts to resolve the alert fail, or no one responds to the alert.
- The Status section, which lets you specify whether or not the alert is active, and change its reported severity.
Configure alerts
The Splunk App for Unix and Linux comes with twelve built-in alerts which you can configure. You can add descriptions, change alert thresholds, add business impact, remediation and escalation information, and choose whether or not each alert is active.
To modify the existing alerts in the Alerts settings page:
1. In the Alerts section, enter a description for the alert in the text box underneath the alert's name.
2. In the Threshold section, drag the slider to adjust when the alert triggers.
Note: You can also click on the text box underneath the slider and enter the number manually. Valid values for the threshold depend on the alert's base search.
3. In the Business Impact text box, enter the impact that the alert represents.
4. In the Remediation text box, enter a sentence that describes what a person who encounters this alert can do to stop it.
5. In the Escalation text box, enter the name of a person or entity that this alert should be escalated to if attempts to resolve the alert fail or are not made.
6. In the Status section, click the Enabled button to enable the alert, or the Disabled button to disable the alert.
7. Drag the slider to adjust the alert's severity, a choice of Info, Medium, or High. The alert's severity determines where and how it displays on the Alerts page.
8. Click the red Save button to save any changes you have made.
Note: Whenever you make a change, the Splunk App for Unix and Linux highlights the Save button in red. This lets you know that any unsaved changes will be lost if you leave the settings page.
| Log in and get started | Dashboard reference |
This documentation applies to the following versions of Splunk® App for Unix and Linux (EOL): 5.2.2, 5.2.3, 5.2.4, 5.2.5


 Download manual
Feedback submitted, thanks!