About Splunk for VMware
Splunk for VMware is a solution built on top of Splunk. Using Splunk best practices it collects data from your inputs and maps and displays that data in custom built dashboards in the Splunk App for VMware. It fits tightly into the Splunk ecosystem using all the core Splunk components.
Solution Components
Install the Splunk for VMware Solution into an environment where Splunk is already installed and running.
Splunk for VMware contains the following four main components:
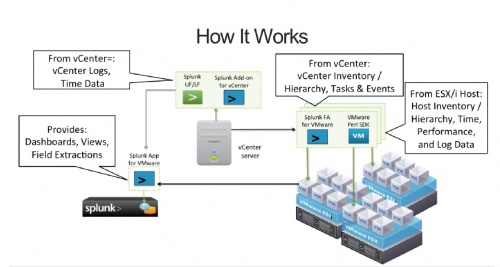
- Splunk App for VMware: This is the App that provided a window to your splunked VMware environment. The data you collect in Splunk is mapped to the views and dashboards in the App. The App contains the UI components, searches, and indexing definitions for your VMware data. Install the App as the splunkadmin user on the indexers and search heads in your environment.
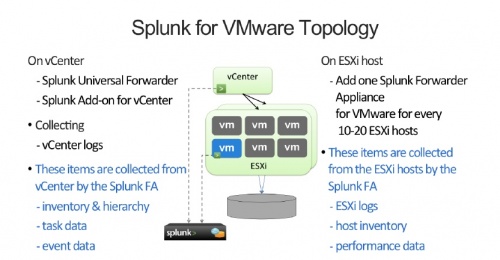
- Splunk Technology Add-on for vCenter: Otherwise known as TA-vcenter. This component forwards vCenter data to the Splunk indexer. Install this component on the same Windows machine on which the vCenter Server resides.
- Splunk Forwarder Virtual Appliance for VMware: Otherwise known as the Splunk FA VM. This is the FA VM image used to collect data from your VMware environment. Install it, using the vSphere client, on each of the ESX and ESXi hosts you want to splunk. The Splunk FA VMs forward their data to the Splunk indexer. Once you have setup your Splunk FA VM, you can clone it and install it on any VM that you want to monitor. The FA VM does not have to reside on the host that it is monitoring. It must be able to authenticate with the vCenter and the ESX/i hosts in the environment.
- Splunk Technology Add-on for VMware: Otherwise identified as TA-vmware. It is packaged with the Splunk Forwarder Virtual Appliance for VMware.
What does it do
Splunk for VMware collects and harnesses data from the virtualization layer to enable true end-to-end visibility in virtualized environments. It provides true operational intelligence using the power of Splunk to collect the data from your VMware environment and map it to the Splunk App for VMware. You can get the insights you need into your IT infrastructure to make informed business and operational decisions. You have the power to search and analyze the data and create reports and alerts on the data in the VMware environment.
You can:
- Collect logs and performance metrics directly from the vSphere hosts. It enables persistence for long term analysis and trending.
- Analyze and report on vCenter (VC) tasks and events to meet any audit/compliance requirements.
- Correlate virtualization layer data with data from other tiers such as applications and operating system information from inside virtual machines as well as the hardware.
How does it work?
The Splunk for VMware solution collects machine data from the following components of your VMware environment:
- ESX and ESXi hosts.
- vCenter(VC) servers.
and forwards the data to a central Splunk instance (Splunk indexer/search head) running the custom-built Splunk App for VMware. The App is the window to your data and enables you to explore your data using the pre-built reports and dashboards.
The Solution gathers a limited amount of information (such as the hostname and IP address) from inside VM guest operating systems if VMware Tools is installed. To collect detailed information from your guest operating systems, you must install forwarders into your virtual machines and install the relevant Splunk App for that operating system, for example, install Splunk for Unix or Splunk for Windows. For more information on installing forwarders into guest operating systems see the associated App documentation. You can get Splunk Apps from Splunkbase.
| About VMware | What data can I get |
This documentation applies to the following versions of Splunk® App for VMware (EOL): 1.0, 1.0.1, 1.0.2, 1.0.3, 2.0


 Download manual
Feedback submitted, thanks!