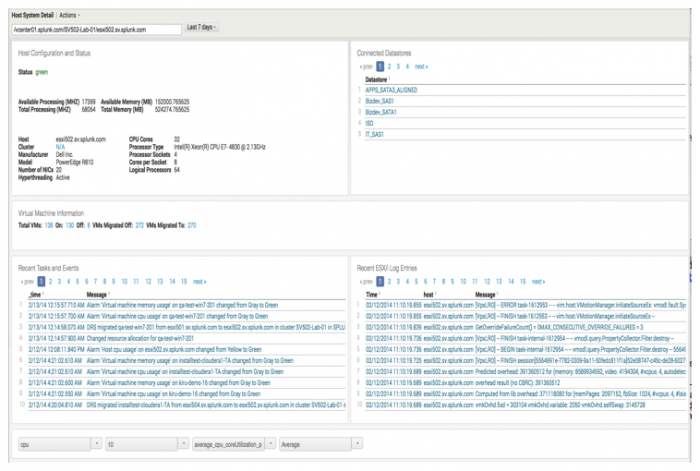
Host System Detail
On this dashboard you can see the details for a specific host system over the time range selected. You can:
- Get a quick view of the state of your host system.
- Identify the root cause of issues on the host.
- Check how the host performs for key performance metrics.
You can drill down to this dashboard from another dashboard to see host detail information, or from the app menu, select Proactive Monitoring > Host System Detail, and search for the specific host using the search bar.
Host Configuration and Status
On this panel get basic configuration information about the state of the specific host. You can see:
- The status of the host.
- The available and total processing power (in MHZ) for the host.
- The available and total memory (in MB) for the host.
- The name of the host. This is the same name that is displayed in the search bar on the dashboard.
- The cluster to which it belongs, if it is configured as part of a cluster.
- Specific manufacturer and model number for the host.
- The hyperthreading status, active or none.
- The resource details of the host. Having sufficient resources is important. The resources include the number of NICs, the number of CPU cores assigned to the host, processor information, and socket information, in addition to the memory and processing allocations.
Connected Datastores
This panel shows a list of datastores connected to the host. Click the datastore name to drill down to the specific details for that datastore, shown on the Datastore Detail dashboard. You get visibility into the file types residing on that datastore. Using this information you can plan your storage requirements for the host.
Virtual Machine Information
This panel displays high level information about the virtual machines that reside on this host. You can see:
- The total number of virtual machines on the host.
- The total number of virtual machines powered on and off.
- The number of virtual machined that migrated off this host.
- The number of virtual machined that migrated on to this host.
Select the value associated with each of the fields to see specific details for that field. For example, click 23 for Total VMs to display a table with details for all the virtual machines on the host.
Recent Tasks and Events
You can view recent tasks associated with the host and event that have occurred on the host. This panel lists all completed tasks on the host. The task list includes tasks performed on the virtual machines on the host. You can see alarms that activate when there was a change status for a resource, for example, "Alarm 'Virtual machine memory usage' on apps-vc200 changed from Yellow to Green".
Use this information to investigate the root cause of problems on your host. For example, if a host goes down, you can see if a particular task caused it. You can also check if the host is resourced correctly.
Recent ESX/i Log Entries
On this panel get a quick look at log files generated by VMware ESXi hosts. ESXi host logs are written to the file system and provide information about system operational events.You can examine the log files in detail drilling down to system events that can identify particular issues in your environment.
Chart of performance data for a host
On this panel you can look at the host system at a very detailed level and control the charting of performance data for a specific host based upon the selections you make from the drop-down lists.
The chart shows the performance of the host for a specific performance data type, mapped against the critical and warning threshold selected for the metric. The chart is driven by performance metrics for the host.
Use the drop-down lists to filter your selection for charting the data. Select from the following:
- The performance type. This is the type of performance data you want to measure.
- Instance data. When instance level data collection is turned on, performance data is collected as specific instances of performance counters. If instance level data is turned on, this drop-down list is populated with an identifier or a number of identifiers derived from configuration information. For example, the name of a disk, virtual Ethernet adapter, or CPU core. If instance level data is not from your environment, then the drop-down list defaults to aggregated (aggregated data for all of the instances).
- The performance metric to measure.
- The statistical operation on the data (average, min, max). This determines the chart results.
The chart displays the critical and warning threshold levels set for the selected metric. The performance of the host in relation to this metric is charted. Check for spikes on the chart and investigate why they are happening.
| Virtual Machine Detail | Cluster Detail |
This documentation applies to the following versions of Splunk® App for VMware (EOL): 3.1, 3.1.1, 3.1.2, 3.1.3, 3.1.4, 3.2.0, 3.2.1, 3.2.2, 3.3.0

 Download manual
Feedback submitted, thanks!