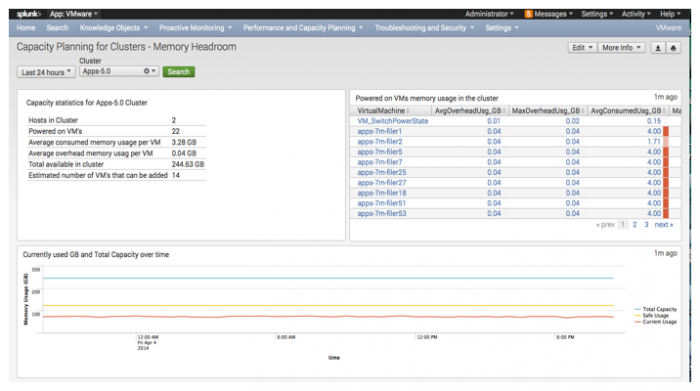
Capacity Planning for Clusters - Memory Headroom
Use this dashboard to get an estimate for the number of virtual machines that you can add to the cluster based on current memory consumption and overhead memory allocated to the virtual machines in the cluster. This dashboard reports only on powered on virtual machines in the cluster.
Using the data on this dashboard you can make better resource provisions to minimize and resolve bottlenecks, increases availability of systems and improve overall performance of the systems.
The Capacity Planning for Clusters - Memory Headroom dashboard displays:
- Capacity statistics for the cluster.
- A list of powered on virtual machines showing their memory usage in the cluster.
- A chart showing current memory usage (in GB) for the cluster, and total memory capacity for the cluster.
Dashboard Panels
To display details for a specific cluster, select a time range and the cluster name from the Cluster drop-down list. The details for the cluster are displayed in the panels.
Capacity statistic
Look on the Capacity statistics panel for information about:
- The number of hosts in the cluster.
- The number of powered on virtual machines.
- Average consumed memory (in GB) per virtual machine.
- Average overhead memory usage (in GB) per virtual machine.
- Total memory available in the cluster (in GB).
- Estimated number of virtual machines that you can add to the cluster.
Powered on virtual machines memory usage in the cluster
Look on this panel to see the memory usage for each powered on virtual machines in the cluster. Virtual machine memory overhead is the amount of machine memory allocated to a virtual machine beyond its reserved amount.This table shows the average and maximum overhead usage (in GB) for each virtual machine.
- AvgOverheadUsg_GB is the metric used to measure the memory used by VMware to actually power the virtual machine.
- MaxOverheadUsg_GB is the metric used to measure the maximum memory used by VMware to actually power the virtual machine, over the summarization period.
- AvgConsumedUsg_GB is the metric used to measure the average memory consumed by the virtual machine in the cluster.
- MaxConsumedUsg_GB is the metric used to measure the maximum amount of memory consumed by a virtual machine over the summarization period.
Currently used (GB) and Total Capacity
A chart displays the total capacity of the cluster, the current cpu usage of the cluster, and safe usage over the time period specified.
| Capacity Planning for Clusters - CPU Headroom | Capacity Forecasting |
This documentation applies to the following versions of Splunk® App for VMware (EOL): 3.3.1

 Download manual
Feedback submitted, thanks!