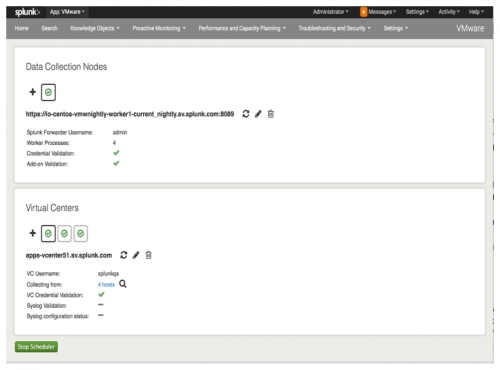
Collection Configuration
Use the Collection Configuration dashboard to configure data collection settings for the Splunk App for VMware.
This is an administration dashboard with restricted access to users of the Splunk App for VMware who have administration privileges. If you do not have these privileges, then you cannot access this dashboard.
Using this dashboard you can:
- Add data collection nodes and VMware vCenter Servers to the scheduler configuration.
- Start the Distributed Collection Scheduler to collect data from your VMware vSphere environment.
- Configure the collection of data from specific hosts systems.
For information on how to set up a data collection node, see "Deploy OVA to create a Data Collection Node" in the Splunk App for VMware Installation Guide.
| Threshold Configuration | App Install Health |
This documentation applies to the following versions of Splunk® App for VMware (EOL): 3.3.2

 Download manual
Feedback submitted, thanks!