vCenter Log Browser
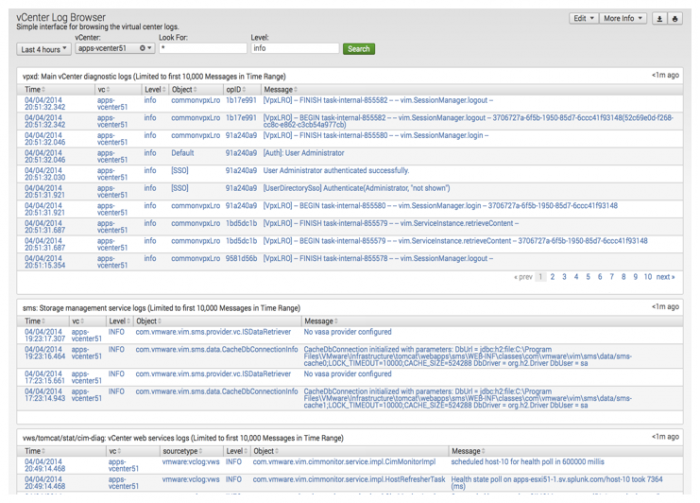
The vCenter Log Browser is a quick and easy way to look at vCenter server logs.
You can browse the following log data:
- Main vCenter diagnostic logs (vpxd).
- Storage management service logs (sms logs).
- vCenter web services logs (vws/tomcat/stat/cim-diag).
For this dashboard to work correctly, you must have vclog data set up to forward to the Splunk App for VMware. See Collect optional log data section of the Splunk Add-on for VMWare manual for detailed instructions.
Use the drop-down lists on the dashboard to filter your search results. The drop-down lists are explain in the table below.
| Field | Description |
|---|---|
| Time range | The time range over which events are reported. |
| vCenter | A list of vCenter servers from which you are collecting syslog data. The default value is All. |
| Look for | Enter the term that you want to specifically search for in the logs. |
| Level | A logging level. This can be DEBUG, INFO, WARN, ERROR, or FATAL. The default is ERROR. |
The following source types must be present for the data to populate the panels:
| Panel | Source type |
|---|---|
| vpxd | vmware:vclog:vpxd
|
| sms | vmware:vclog:sms
|
| vws/tomcat/stat/cim-diag | vmware:vclog:vws or vmware:vclog:stats or vmware:vclog:cim-diag or vmware:vclog:vim-tomcat-shared or vmware:vclog:tomcat
|
| ESXi Log Browser | ESXi Hosts Task Overview |
This documentation applies to the following versions of Splunk® App for VMware (EOL): 3.4.1, 3.4.2, 3.4.3, 3.4.4, 3.4.5, 3.4.7

 Download manual
Feedback submitted, thanks!