Protocol Intelligence dashboards
Protocol Intelligence is a collection of dashboards and searches that report on the information collected from common network protocols. As an analyst, use these dashboards to gain insight into HTTP, DNS, TCP/UDP, TLS/SSL, and common email protocols across your system or network.
The Protocol Intelligence dashboards use packet capture data from apps such as "Splunk Stream" and the "Splunk Add-on for Bro IDS". Without applicable data, the dashboards remain empty.
Packet capture data contains security-relevant information not typically collected in log files. Integrating network protocol data provides a rich source of additional context when detecting, monitoring, and responding to security related threats.
For information about integrating Splunk Stream with the Splunk App for Enterprise Security, see "Splunk Stream integration" in the Enterprise Security Installation and Configuration Manual.
For information about the protocols supported in Splunk Stream, see "Supported Protocols" in the Splunk Stream User Manual.
Protocol Center
The Protocol Center dashboard provides an overview of the security-relevant network protocol data. The dashboard searches displays results based on the time period selected on the dashboard time picker.
Dashboard Panels
| Panel | Description |
|---|---|
| Key Indicators | Displays the metrics relevant to the dashboard sources over the past 24 hours. Key indicators represent summary information and appear at the top of the dashboard. See "Key indicators" in this manual. |
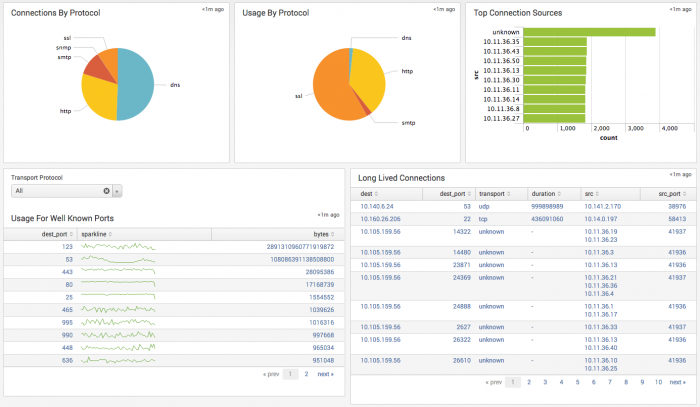
| Connections By Protocol | Displays the sum of all protocol connections, sorted by protocol over time. The connection distribution by protocol shows the most common protocols used in an environment, such as email protocols and HTTP/SSL. An exploited protocol may display a disproportionate number of connections for its service type. |
| Usage By Protocol | Displays the sum of all protocol traffic in bytes, sorted by protocol over time. The bandwidth used per protocol will show consistency relative to the total network traffic. An exploited protocol may display a traffic increase disproportionate to its use. |
| Top Connection Sources | Displays the top 10 hosts by total protocol traffic sent and received over time. A host displaying a large amount of connection activity may be heavily loaded, experiencing issues, or represent suspicious activity. The drilldown redirects the page to the Traffic Search dashboard and searches on the selected source IP. |
| Usage For Well Known Ports | Displays the sum of protocol traffic, sorted by ports under 1024 over time. The bandwidth used per port will show consistency relative to the total network traffic. An exploited port may display an increase in bandwidth disproportionate to its use. The drilldown redirects the page to the Traffic Search dashboard and searches on the selected port. |
| Long Lived Connections | Displays TCP connections sustained longer than 3 minutes. A long duration connection between hosts may represent unusual or suspicious activity. The drilldown redirects the page to the Traffic Search dashboard and searches on the selected event. |
Data sources
The reports in the Protocol Center dashboard use fields in the Network Traffic data model. Relevant data sources include all the devices or users generating TCP and UDP protocol traffic on the network captured from vulnerability scanners and packet analysis tools such as Splunk Stream and the Bro network security monitor.
Troubleshooting
For information about troubleshooting, see "Troubleshooting Protocol Intelligence dashboards" in this topic.
DNS
The DNS dashboard displays an overview of data relevant to the DNS infrastructure being monitored. The dashboard searches displays results based on the time period selected on the dashboard time picker.
Dashboard Panels
| Panel | Description |
|---|---|
| Key Indicators | Displays the metrics relevant to the dashboard sources over the past 24 hours. Key indicators represent summary information and appear at the top of the dashboard. See "Key indicators" in this manual. |
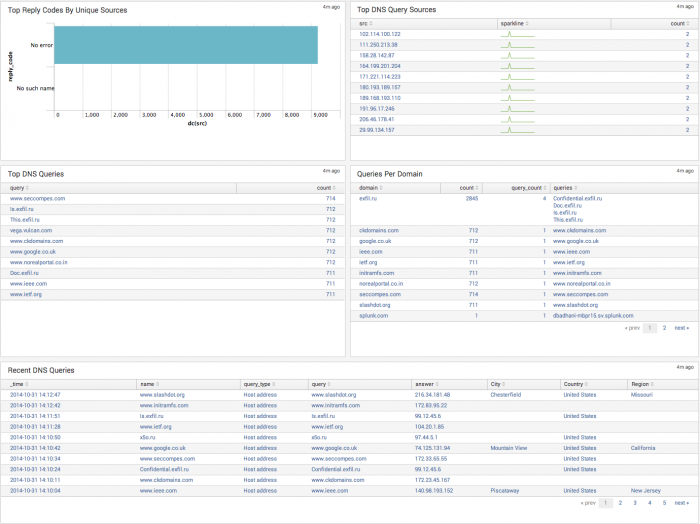
| Top Reply Codes By Unique Sources | Displays the top DNS Reply codes observed across hosts. A host initiating a large number of DNS queries to unknown or unavailable domains will report a large number of DNS lookup failures with some successes. That pattern of DNS queries may represent an exfiltration attempt or suspicious activity. The drilldown redirects the page to the DNS Search dashboard and searches on the selected Reply Code. |
| Top DNS Query Sources | Displays the top DNS query sources on the network. A host sending a large amount of DNS queries may be improperly configured, experiencing technical issues, or represent suspicious activity. The drilldown redirects the page to the DNS Search dashboard and searches on the selected source IP address. |
| Top DNS Queries | Displays the top 10 DNS QUERY requests over time. The drilldown redirects the page to the DNS Search dashboard and searches on the queried host address. |
| Queries Per Domain | Displays the most commonly queries grouped by domain. An unfamiliar domain receiving a large number of queries from hosts on the network may represent an exfiltration attempt or suspicious activity. The drilldown redirects the page to the DNS Search dashboard and searches on the queried domain address. |
| Recent DNS Queries | Displays the 50 most recent DNS Response queries with added detail. The drilldown redirects the page to the DNS Search dashboard and searches on the selected queried address. |
Data sources
The reports in the DNS dashboard use fields in the Network Resolution data model. Relevant data sources include all the devices or users generating DNS protocol traffic on the network captured from vulnerability scanners and packet analysis tools such as Splunk Stream and the Bro network security monitor.
Troubleshooting
For information about troubleshooting, see "Troubleshooting Protocol Intelligence dashboards" in this topic.
DNS Search
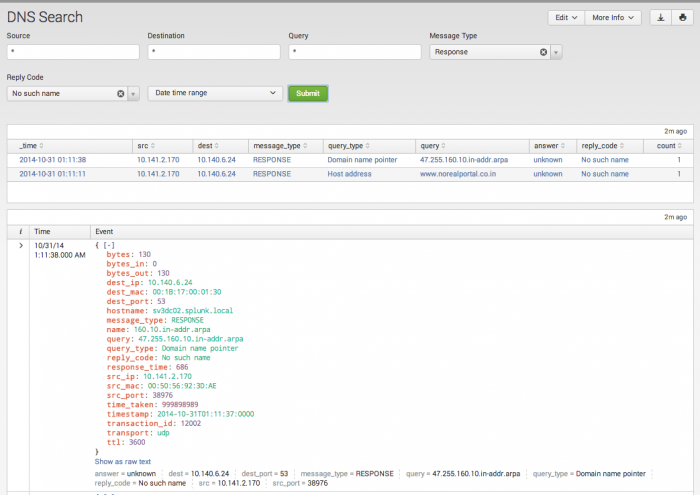
The DNS Search dashboard assists in searching DNS protocol data, based upon the criteria defined by the search filters. The dashboard is used in ad-hoc searching of DNS data, but is also the primary destination for drilldown searches used in the DNS dashboard panels.
The DNS Search page displays no results by default unless it was opened in response to a drilldown action, or the user sets a filter and/or time range and chooses Submit.
| Filter by | Description | Action |
|---|---|---|
| Source | Source IP address | Text field. Empty by default. Wildcard with an asterisk (*) |
| Destination | Destination IP address | Text field. Empty by default. Wildcard with an asterisk (*) |
| Query | DNS Query | Text field. Empty by default. Wildcard with an asterisk (*) |
| Message Type | DNS Message type: Query, Response, or All. | Drop-down: select to filter by |
| Reply Code | DNS Reply type: All, All Errors, and a list of common Reply Codes | Drop-down: select to filter by |
SSL Activity
The SSL Activity dashboard displays an overview of the traffic and connections utilizing SSL. As an analyst, use these dashboards to view and review SSL encrypted traffic by usage, without decrypting the payload. The dashboard searches displays results based on the time period selected on the dashboard time picker.
Dashboard Panels
| Panel | Description |
|---|---|
| Key Indicators | Displays the metrics relevant to the dashboard sources over the past 24 hours. Key indicators represent summary information and appear at the top of the dashboard. See "Key indicators" in this manual. |
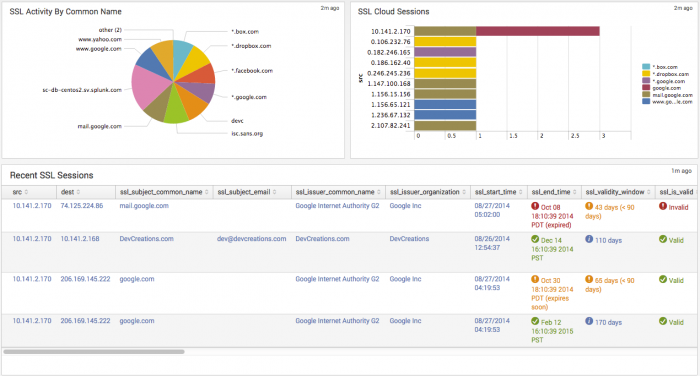
| SSL Activity By Common Name | Displays outbound SSL connections by common name of the SSL certificate used. An unfamiliar domain receiving a large number of SSL connections from hosts on the network may represent unusual or suspicious activity. The drilldown redirects the page to the SSL Search dashboard, and searches on the selected common name. |
| SSL Cloud Sessions | Displays the count of active sessions by common name that represents a known cloud service. The CN is compared to a list of cloud service domains pre-configured in the Cloud Domains lookup file. For more information about editing lookups in the ES app, see "Lists and Lookup editor" in the Installation and Configuration manual. The drilldown redirects the page to the SSL Search dashboard and searches on the selected source IP and common name. |
| Recent SSL Sessions | Displays the 50 most recent SSL sessions in a table with additional information about SSL key. The fields ssl_end_time, ssl_validity_window, and ssl_is_valid use color-coded text for fast identification of expired, short lived, or invalid certificates. The drilldown redirects the page to the SSL Search dashboard and displays the full details of the selected event.
|
Data sources
The reports in the SSL Activity dashboard use fields in the Certificates data model. Relevant data sources include all the devices or users generating SSL protocol traffic on the network captured from vulnerability scanners and packet analysis tools such as Splunk Stream and the Bro network security monitor.
Troubleshooting
For information about troubleshooting, see "Troubleshooting Protocol Intelligence dashboards" in this topic.
SSL Search
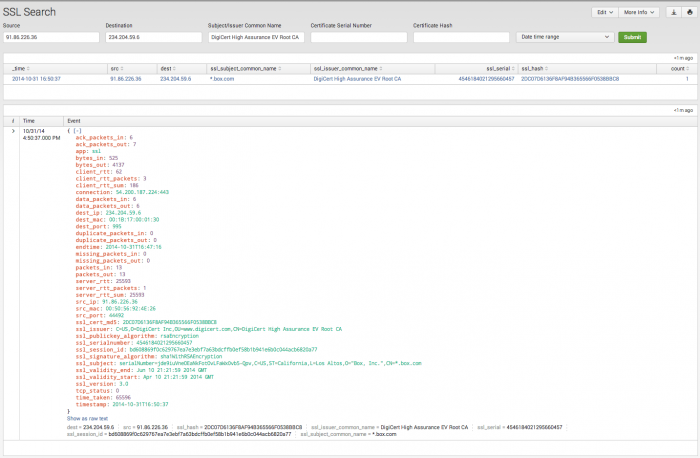
The SSL Search dashboard assists in searching SSL protocol data, based upon the criteria defined by the search filters. The dashboard is used in ad-hoc searching of SSL protocol data, but is also the primary destination for drilldown searches used in the SSL Activity dashboard panels.
The SSL Search page displays no results by default unless it was opened in response to a drilldown action, or the user sets a filter and/or time range and chooses Submit.
| Filter by | Description | Action |
|---|---|---|
| Source | Source IP address | Text field. Empty by default. Wildcard with an asterisk (*) |
| Destination | Destination IP address | Text field. Empty by default. Wildcard with an asterisk (*) |
| Subject/Issuer Common Name | Common name retrieved from the x.509 certificate Subject or Issuer fields. | Text field. Empty by default. Wildcard with an asterisk (*) |
| Domain | Common name retrieved from the x.509 certificate Subject field. | Text field. Empty by default. Wildcard with an asterisk (*) |
| Certificate Serial Number | The x.509 certificate Serial Number field. | Text field. Empty by default. Wildcard with an asterisk (*) |
| Certificate Hash | The x.509 certificate Signature field. | Text field. Empty by default. Wildcard with an asterisk (*) |
Email Activity
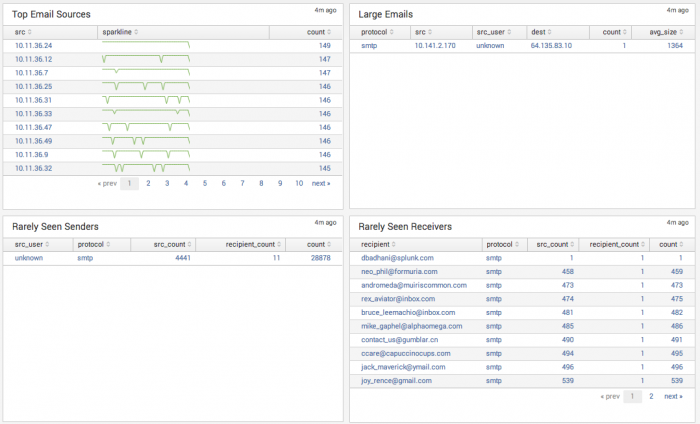
The Email Activity dashboard displays an overview of data relevant to the email infrastructure being monitored. The dashboard searches displays results based on the time period selected on the dashboard time picker.
Dashboard Panels
| Panel | Description |
|---|---|
| Key Indicators | Displays the metrics relevant to the dashboard sources over the past 24 hours. Key indicators represent summary information and appear at the top of the dashboard. See "Key indicators" in this manual. |
| Top Email Sources | Displays the hosts generating the most email protocol traffic. A host sending excessive amounts of email on the network may represent unusual or suspicious activity. Periodicity displayed across hosts viewed on the sparklines may be an indicator of a scripted action. The drilldown redirects the page to the Email Search dashboard and searches on the selected source IP. |
| Large Emails | Displays the hosts sending email greater than 2MB. A host that repeatedly sends large emails may represent suspicious activity or data exfiltration. The drilldown redirects the page to the Email Search dashboard and searches on the selected source IP. |
| Rarely Seen Senders | Displays Sender email addresses that infrequently send email. An address that represents a service account or non-user sending email may indicate suspicious activity or a phishing attempt. The drilldown redirects the page to the Email Search dashboard and searches on the selected Sender. |
| Rarely Seen Receivers | Displays Receiver email addresses that infrequently receive email. An address that represents a service account or non-user receiving email may indicate suspicious activity or a phishing attempt. The drilldown redirects the page to the Email Search dashboard and searches on the selected Recipient. |
Data sources
The reports in the Email dashboard use fields in the Email data model. Relevant data sources include all the devices or users generating email protocol traffic on the network captured from vulnerability scanners and packet analysis tools such as Splunk Stream and the Bro network security monitor.
Troubleshooting
For information about troubleshooting, see "Troubleshooting Protocol Intelligence dashboards" in this topic.
Email Search
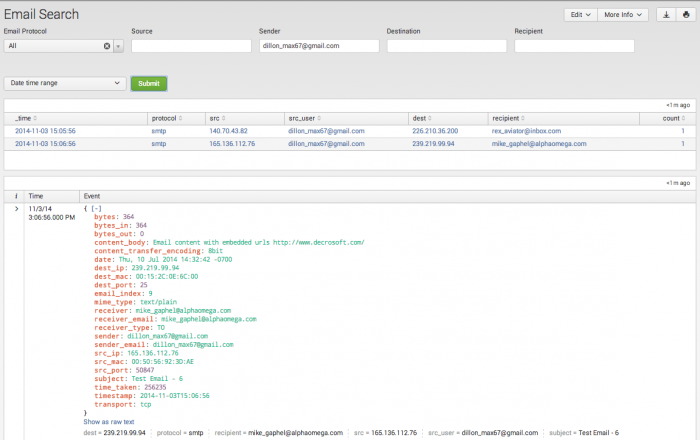
The Email Search dashboard assists in searching email protocol data based upon the criteria defined by the search filters. The dashboard is used in ad-hoc searching of email protocol data, but is also the primary destination for drilldown searches used in the Email Activity dashboard panels.
The Email Search page displays no results by default unless it was opened in response to a drilldown action, or the user sets a filter and/or time range and chooses Submit.
| Filter by | Description | Action |
|---|---|---|
| Email Protocol | The email communication protocol. | Drop-down. Select to filter by. |
| Source | Source IP address | Text field. Empty by default. Wildcard with an asterisk (*) |
| Destination | Destination IP address | Text field. Empty by default. Wildcard with an asterisk (*) |
| Sender | The sender's email address. | Text field. Empty by default. Wildcard with an asterisk (*) |
| Recipient | The recipient's email address. | Text field. Empty by default. Wildcard with an asterisk (*) |
Troubleshooting Protocol Intelligence dashboards
1. The Protocol Intelligence dashboards use packet capture data from apps such as "Splunk Stream" and the "Splunk Add-on for Bro IDS". Without the applicable data, the dashboards remain empty. For an overview of Splunk Stream integration with the ES app, see "Splunk Stream integration" in the Installation and Configuration Manual.
2. Use the Open in Search link available in the lower left corner of a dashboard view to perform a direct search against the data model. The New Search dashboard also exposes the search commands and objects used to populate the view.
3. Determine if any data required for a dashboard is available in the data model.
- a. Determine the data model objects used by a dashboard:
Dashboard Data model Protocol Center Uses the "Network Traffic" data model objects:
- All_Traffic.app
- All_Traffic.bytes
- All_Traffic.dest
- All_Traffic.dest_port
- All_Traffic.duration
- All_Traffic.src
- All_Traffic.src_port
- All_Traffic.transport
DNS Uses the "Network Resolution (DNS)" data model objects:
- DNS.message_type
- DNS.query
- DNS.reply_code
- DNS.src
SSL Activity Uses the "Certificates" data model objects:
- All_Certificates.SSL
- All_Certificates.src
- All_Certificates.SSL.ssl_subject_common_name
Email Activity Uses the "Email" data model objects:
- All_Email.dest
- All_Email.recipient
- All_Email.protocol
- All_Email.size
- All_Email.src
- All_Email.src_user
- b. Use the data model and data model object to search for events in the data model:
Action Search Expected Result Verify the data is normalized to the Common Information Model | datamodel data_model_name root_object_name search | table _time, sourcetype, root_object_name.* Example: | datamodel Network_Traffic All_Traffic search | dedup sourcetype | table _time, sourcetype, All_Traffic.*
Returns a list of sourcetypes and the data model objects and fields populated by that sourcetype.
4. Validate the data model is being accelerated.
- In the Splunk App for Enterprise Security, browse to Audit > Data Model Audit. Review the Acceleration Details panel for information about the data model acceleration status.
- Note: For more information about data model acceleration and the Enterprise Security App, see "Data models in the Enterprise Security app" in the Installation and Configuration manual
| Advanced Threat dashboards | Access dashboards |
This documentation applies to the following versions of Splunk® Enterprise Security: 3.2, 3.2.1, 3.2.2, 3.3.0, 3.3.1, 3.3.2, 3.3.3




 Download manual
Feedback submitted, thanks!