Smart Outlier Detection Assistant
The Smart Outlier Detection Assistant enables machine learning outcomes for users with little to no SPL knowledge. This Assistant is built on the backbone of the Experiment Management Framework (EMF), offering enhanced outlier detection abilities. The Smart Outlier Detection Assistant provides a guided workflow that moves through the stages of Define, Learn, Review, and Operationalize to load data, build your model, and put that model into production. Each stage offers a data preview and visualization panel.
This Assistant leverages the DensityFunction algorithm which persists a model using the fit command that can be used with the apply command. DensityFunction creates and stores density functions for use in anomaly detection. DensityFunction groups the data, where for each of these groups a separate density function is fitted and stored.
To learn more about the Smart Outlier Detection Assistant algorithm, see DensityFunction algorithm.
The accuracy of the anomaly detection for DensityFunction depends on the quality and the size of the training dataset, how accurately the fitted distribution models the underlying process that generates the data, and the value chosen for the threshold parameter.
Smart Outlier Detection Assistant Showcase
You can gain familiarity with this Assistant through the MLTK Showcase, accessed under its own tab. The Smart Outlier Detection Showcase examples include:
- Find Anomalies in Hard Drive Metrics
- Find Anomalies in Supermarket Purchases

Click the name of any Smart Outlier Detection Showcase to see this Assistant in action using pre-loaded test data and pre-selected outlier detection parameters.
Smart Outlier Detection Assistant workflow
Move through the stages of Define, Learn, Review, and Operationalize to draw in data, build your model, and put that model into production.
- Select Smart Outlier Detection from the Experiments landing page and the Create New Experiment button in the top right.
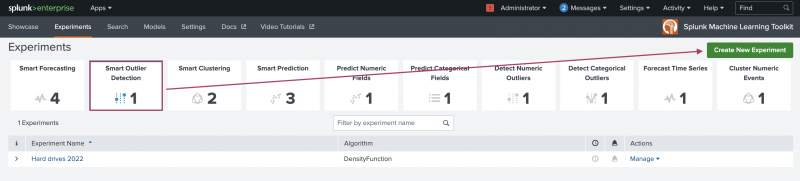
- Enter an Experiment Title, and optionally add a Description.
- Click Create to move into the Assistant interface.

Define stage
Use the Define stage to select and preview the data you want to use for the outlier detection.
- Select your data. You have three options to pull data into the Assistant and you can pull data in from anywhere in the Splunk platform.
Datasource option Description Search Use if your datasource is a stored dataset. You can use the Search bar to modify your dataset data in advance of using that data within the Learn step. Datasets Use to find any data you have ingested into Splunk, as well as any datasets that ship with Splunk Enterprise and the Machine Learning Toolkit. You can filter by type to find your preferred data faster. Metrics Use to find any metrics data you have gathered and stored as a custom index type without the need to write any SPL. This index might include data from systems including hosts, network devices, web servers, and SaaS systems. To learn more, see About the Splunk Metrics Workspace. - Once data is selected, the Data Preview and Visualization tabs populate.
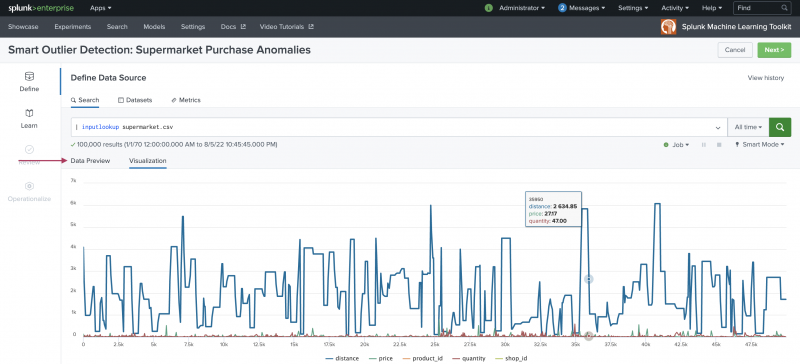
- Choose a time-range to narrow down the data time frame. The default setting of All time can be changed to suit your needs.
- When you are finished selecting your data, click Next in the top right, or Learn from the left hand menu to move on to the next stage of the Assistant.

Learn stage
Use the Learn stage to build your outlier detection model. Under Initial data you can review the data selected in the Define stage.
- Use the +Add preprocessing step to extract time features from your data. The following fields are extracted:
atf_hour_of_day,atf_day_of_week,atf_day_of_month, andatf_month.
The preprocessing step only works on data that includes a valid
_timefield. - Under Detect Outliers make field selections to drive the outlier detection results.
Hover over the in-app question mark helper icons beside fields to view field descriptions. Refer to the following table for information on each available Detect Outliers field:
Field name Required or optional Description Field to analyze Required From the drop-down menu populated from your data set, select the field from which you wish to perform outlier detection. Split by fields Optional Select up to five fields. Use split by field(s) if the anomaly might be different based on the data in a particular field. You will not generate a cardinality histogram without the selection of at least one split by field. Distribution type Required Choose the distribution type based on the statistical behavior of the data. Leave as default selection of Auto if unsure. Outlier tolerance threshold Required Adjust as needed based on the number of expected outliers. Notes Optional Use this free form block of text to track the selections made in the parameter fields. Refer back to notes to review which parameter combinations yield the best results. - Complete your field selections and click Detect Outliers to view results.
- Clicking Detect Outliers creates the model using the
fitcommand and produces a written summary of the chosen model parameters at the top of the page. The Experiment is now in a Draft state, and the View History option is available. View History allows you to track any changes you make in the Learn stage.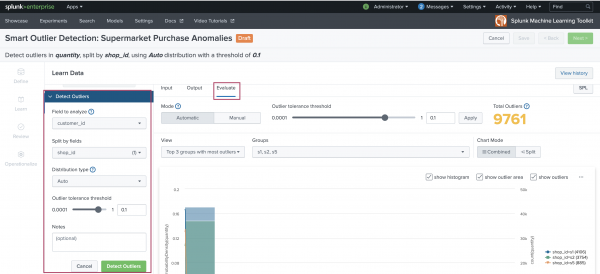
Making adjustments or changes to the Detect Outliers fields and clicking the Detect Outlier button retrains the model using the
fitcommand. This process can be compute intensive. The Smart Outlier Detection Assistant offers the option to make changes to some of the available fields without using the Detect Outliers section. You can make changes on the Evaluate tab, rather than the the Detect Outliers fields, to tune the model parameters using theapplycommand. This option can be less compute intensive as you can update model settings without retraining the model. - The SPL button is also available as a means to review the Splunk Search Processing Language being auto-generated for you in the background as you work through the Assistant, or to fit the SPL in a new search tab.
- When you are happy with your results, click Next in the top right, or Review from the left-hand menu to move on to the next stage of the Assistant.
If you change the Outlier tolerance threshold parameter without retraining the model, and you try to move on to the Review stage, you will see a pop-up modal window. Choose '''Keep Original Threshold''' or ''Update Threshold'''. The update option retrains the model using the adjusted parameter setting and updates this setting in the Detect Outliers menu.

Review stage
Use the Review stage to explore the resulting model based on the fields selected at the Learn stage. The Review panels let you assess your outlier detection results prior to putting the model into production.
- Use the available panels as follows:
Panel name Description Model Summary This is the default view showing a summary table based on selections made in the Learn stage. Cardinality Histogram View a histogram of groups by number of data points. Groups are based on any fields chosen in the Learn stage and the split by fields section. Having fewer numbers of low value in this histogram can be an indication of a more reliable model. To see different results, increase the amount of data in the search or change the fields selected in the split by fields section. No results view generates if no split by fields were selected at the Learn step. Distribution Properties Use this view to get a sense of how groups with a similar type of distribution relate to one another. A histogram of mean and standard deviation that is sharp and narrow can mean that most of those groups have similar statistical behavior. Two distinct peaks in the histograms can signal two obvious characteristics in the groups worthy of further investigation. No results view generates if no split by fields were selected at the Learn step. Outlier Analysis View outliers by any field selections made in the Learn stage and the split by fields section. Use this breakdown to gain insight into individual dimensions that could require further investigation. No results view generates if no split by fields were selected at the Learn step. - Navigate back to the Learn stage to make outlier detection adjustments or click Save and Next to continue.
- Clicking Save and Next generates a modal window that offers the opportunity to update the Experiment name or description. When ready, click Save.

Operationalize stage
The Operationalize stage provides publishing, alerting, and scheduled training in one place. Click Done to move to the Experiments listings page.

The Experiments listing page provides a place to publish, set up alerts, and schedule training for any of your saved Experiments across all Assistant types including Smart Outlier Detection.
Learn more
To learn about implementing analytics and data science projects using Splunk platform statistics, machine learning, and built-in and custom visualization capabilities, see the Splunk 8.0 for Analytics and Data Science course.
| Smart Forecasting Assistant | Smart Clustering Assistant |
This documentation applies to the following versions of Splunk® Machine Learning Toolkit: 5.3.3, 5.4.0, 5.4.1, 5.4.2, 5.5.0, 5.6.0
Feedback submitted, thanks!