Explore your Flow
The marketing team at Buttercup Games wants to know if customers use a coupon code from the new advertising campaign. Explore your Flow to identify customer behavior in the Flowchart, compare Journeys in AB mode, and view metrics to analyze your Journeys and glean meaningful insights about the customer workflow in the online store.
Enable AB mode and compare time ranges
Use the flowchart feature to identify unusual behavior in the customer workflow of the online store.
- Click Flowchart in the feature panel.
The Flowchart reflects the number of Journeys that contain each step. - Select Journey Step Count in the Properties panel.
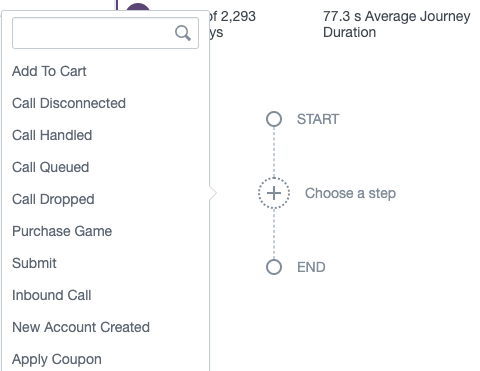
Journey Step Count is the number of unique Journeys that pass through each step. For example, suppose that you have ten Journeys. Four of the Journeys pass through step A. Even if one of the four Journeys loops back to step A, the Journey step count for step A is four. - Select Path Count in the Properties panel.
A path is the span between two steps in a Journey. Select Path Count to view the number of times a step occurs after the proceeding step. For example, suppose you have the following steps in a Journey: add-to-cart, apply coupon, purchase item, payment accepted. If you select the Path Count view, you can see how many times the apply coupon step occurs after the add-to-cart step in the Flowchart. Select Path Avg. Duration to see the average amount of time between a step. - Click the AB comparison icon
 to enable AB mode.
 - In row A, click the time range picker.
- Under Date Range, select Before.
- Enter
8/2/2018 - Click Apply.
- In row B, click the time range picker.
- Under Date Range, select Since
- Enter
8/2/2018 - Click Apply.
The flowcharts reveal a significant difference in the customer Journeys before and after August 2, 2018.
Calculate conversion rates
Find and compare conversion rates for A and B.
- Click Conversion in the feature bar.
- In panel A, click Choose a step.
- Select
Add To Cart. - In panel A, click Choose a step.
- Click
Apply Coupon. - In panel A, click Choose a step.
- Click
Purchase Game. - Repeat steps three through seven in panel B.

The results show that the conversion rate before August, 2018, and since August 2, 2018, more than doubles for customers who purchase items with the coupon!

Compare marketing campaign performance
Let's drill down by attribute to see how the marketing campaign performs in different locations.
- Click Attributes in the feature panel.
- Click on the UK portion of the graph in A to drill down to customer Journeys only from the UK.
- Click on the USA portion of the graph in B to drill down to customer Journeys only from the USA.
View Journey metrics
Use the Metrics feature to view a summary of the Journey data.
- Click Metrics in the feature panel.
- Select show
Avg. Journey Duration,Journey Count,Conversion Rate.
A represents the UK and B represents the USA. The marketing team will be interested to see that the coupon usage was significantly higher in the USA. The Conversion Rate shows that the number of customers who used a coupon code to buy a game increased by 6%, since August 2, 2018.
View Journeys that ended in a dropped call
Let's take a look at the Journeys that ended in a dropped call.
- In the feature panel, click the X by the B panel to close AB mode.
- In the time range picker, select All Time.
- In the Filter bar, click Start & End.
- Under Ends with, select Call Dropped.
Save a Filter Set and add a Notification to your Flow
You want to know when more than 15% of the calls placed to support end because the call was dropped. Next, save your Filter selections as a Filter Set to refer back to the view or create alternative views of your Flow. In SBF, you can create a Notification on your Filter Set that notifies you when Journeys in your Filter Set meet your defined trigger conditions. You can create up to two Notifications per Filter Set.
- Click (Unsaved Filter Set)
- Select Save As.
- Type
Flow Tutorialin the Name box. - (Optional) Type a description.
- Click + Notification.
- Type
Call Droppedin the Notification name box. - From Schedule, select Run every day.
- Select Number of Journeys greater than 15%.
- Select severity Medium.
- (Optional) Type your email address in the box.
- Click Save.
|
PREVIOUS Get to know the Flow Explore features |
NEXT Monitor and edit your Flow |
This documentation applies to the following versions of Splunk® Business Flow (Legacy): -Latest-
Feedback submitted, thanks!