Use IP addresses to generate a choropleth map
The iplocation command is often the easiest way to generate a map from events with associated IP addresses. If you have IP address data in your events, you can use iplocation to look up their location information in a third-party database and generate location fields in the search results.
Depending on the information available for the IP addresses in your data, iplocation can generate location fields including City, Country, Region, latitude, and longitude in your events. By setting the optional allfields argument to true, you can also add Continent fields.
Geolocation using IP addresses is useful for determining approximate locations, rather than precise addresses. Your Splunk platform instance includes a copy of the ip-to-city-lite.mmdb database file, which provides city-level location information for the listed IP addresses.
For more information about the ip-to-city-lite.mmdb file, including instructions for downloading and installing updated versions of the file, see the iplocation command topic in the Search Reference manual.
If you want to map data more precisely, you need to use data with more detailed location information than IP addresses and configure a geospatial lookup with your desired geographic boundaries. See Configure geospatial lookups in the Knowledge Manager Manual to learn more.
Prerequisites
- Data with associated IP addresses, such as web access logs. The examples in this topic use the
sourcetype=access_combined_wcookiedata from the Search Tutorial. To follow along with the examples, see Download the tutorial data files and then Upload the tutorial data for instructions on uploading the data. - Perform field extraction to isolate the IP addresses as necessary. See Build field extractions with the field extractor in the Knowledge Manager Manual.
- Familiarize yourself with geospatial visualizations. See Generate a choropleth map to learn more about choropleth maps.
- Determine what geospatial lookup file you want to use for the boundaries in your choropleth map. To use a lookup other than the us_states and world_countries files that come with Splunk software, see Define a geospatial lookup in Splunk Web in the Knowledge Manager Manual.
Add geographic information to your data
You can retrieve geographic information associated with the IP addresses in your data from a third-party database using the iplocation command.
- Navigate to the Search view of the Search & Reporting App.
- Type the following into the search bar to refine your search to include the events that contain IP addresses.
source="tutorialdata.zip" sourcetype=access_combined_wcookie clientip=* - Add the following to your search to use the
iplocationcommand with the name of the IP address field as the argument.| iplocation clientip - Verify that new location fields have been added in the Interesting Fields column beside your events.
In the tutorial data, theCity,Country,Region,lat, andlonfields are added to the events.
Generate a choropleth map
Now that you have added fields with geographic information, you can use the stats and geom commands to create a choropleth map visualization.
- Building on the search you began in the previous task, use a transforming command to aggregate the data so that you have one row per feature in the geographic feature collection by which you want to map the data.
| stats count by Country - Add the following to your search to use the
geomcommand to add geographic boundaries to the rows in your table.| geom geo_countries allFeatures=True featureIdField=Country - Use the complete search to generate your map
| stats count by Country| geom geo_countries allFeatures=True featureIdField=Country
The following table explains the purpose of the two arguments included in this search:
Argument Purpose allFeatures=trueEnsures all features in the featureCollection are displayed on the map, even if the aggregated data does not have a value for each feature in the collection. featureIdFieldProvides the name of the field that maps to the features in your geospatial lookup if it has a name other than "featureId". - Run the search.
- Select the Visualization tab and select Choropleth Map from the visualization options. If the feature you want to map is numeric, the choropleth visualization generates bins with corresponding shading. If it's categorical, the visualization designates a color for each category.
- Adjust the settings of your choropleth map as desired.
- If the features aren't colored as you expected, it's possible that the values are too concentrated in a particular bin to display properly. Try adjusting the base search to eliminate outliers.
- See Generate and configure your choropleth map for more information about how to configure your choropleth map.
- (Optional) Save your map to a report or dashboard.
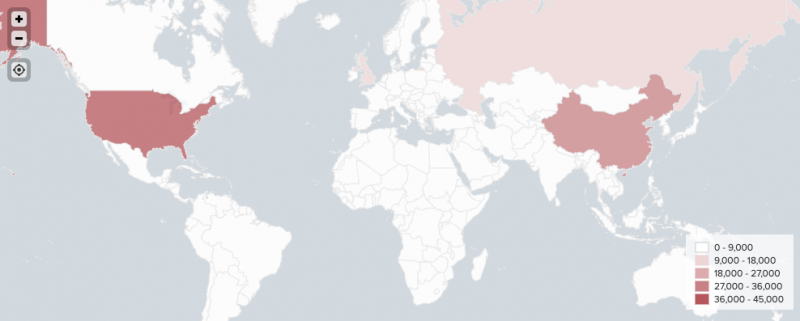
The shading in the completed choropleth map represents the number of client IP addresses linked to each country on the map:

| Configure a choropleth map | Cluster maps |
This documentation applies to the following versions of Splunk Cloud Platform™: 9.3.2411, 9.0.2205, 9.0.2208, 9.0.2209, 9.0.2303, 9.0.2305, 9.1.2308, 9.1.2312, 9.2.2403, 9.2.2406, 9.3.2408 (latest FedRAMP release), 8.2.2203
 Download manual
Feedback submitted, thanks!