Review threats and anomalies in your environment
You can use the Threats and Anomalies dashboards to get an overview of the threats and anomalies that UBA discovers in your environment. Understand the threats and anomalies as they relate to other metrics.
There are limits to the to the total number of threats and anomalies that Splunk UBA can process. It is important to perform regular maintenance of your Splunk UBA deployment by managing the number of threats and anomalies in your system. See Manage the number of threats and anomalies in your environment in Administer Splunk User Behavior Analytics.
Threats Dashboard
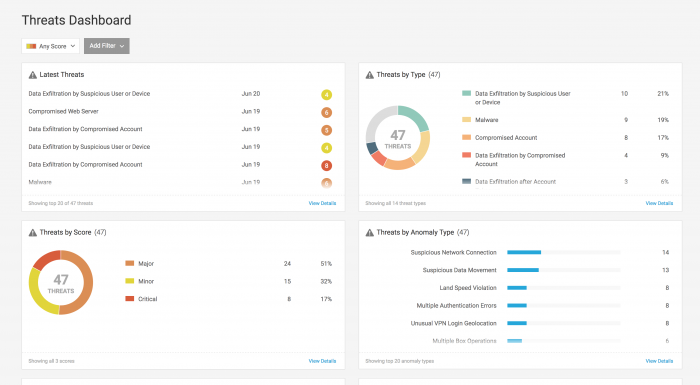
Use the Threats Dashboard to get an overview of current threats in your environment. You can focus on threats from any time and of any score, or you can select Add Filter to get a more focused view of threats.
To access the Threats Dashboard:
- Select the Threats indicator on the home page, or select Explore > Threats from the menu.
- Click the
 icon.
icon.
On the Threats Dashboard page:
- See the most recent threats in Latest Threats.
- Understand more about the threats in your environment by reviewing the Threats by Type and Threats by Anomaly Type panels.
- Determine whether users or devices on a watchlist are involved in any threats with the Threats by Watchlist panel.
- Review the types, volume, and risk scores of threats over time with the Threats Timeline.
- Use the Threats Trend panel to understand whether threats in your organization are increasing or decreasing.
- Understand which anomaly types are generating the most threats in the Threats by Anomalies panel.
- Identify high-risk users in Threats by User, or high-risk departments in Threats by Department.
- If you set up a user watchlist, review the Threats by User Watchlist to see if those watchlisted users are involved in threats.
- Review the threats involved with different devices with the Threats by Device and Threats by Device Type panels.
- The Threats by App panel displays whether some apps are involved in more threats than others.
- Threats by Domain can help you understand whether some domains are more involved in threats than others.
Click a value in a panel to see the Threat Table filtered accordingly. For example, click a device type of USB from the Threats by Device Type panel to see the threats affecting USB devices.
Anomalies Dashboard
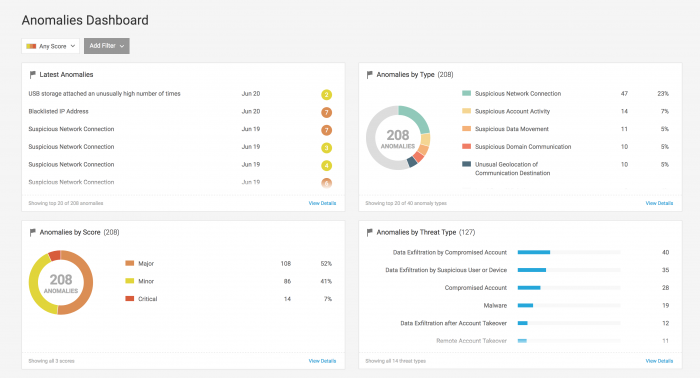
Get an overview of the anomalous activity in your environment with the Anomalies Dashboard. You can focus on anomalies from any time and of any score, or you can select Add Filter to get a more focused view of the anomalies.
To access the Anomalies Dashboard:
- Select the Anomalies indicator on the home page, or select Explore > Anomalies from the menu.
- Click the
 icon.
icon.
On the Anomalies Dashboard page, you can view anomalies in the same categories as threats, though instead of viewing Threats by Anomaly Type, view Anomalies by Threat Type. Click a specific anomaly to drill down to the Anomaly Details for a specific anomaly.
Generate a CSV report based on the dashboard using the Generate Report option.
| Search for entities, anomalies, and threats in Splunk UBA | Manage the number of threats and anomalies in your environment |
This documentation applies to the following versions of Splunk® User Behavior Analytics: 5.0.0, 5.0.1, 5.0.2, 5.0.3, 5.0.4, 5.0.4.1, 5.0.5, 5.0.5.1


 Download manual
Feedback submitted, thanks!