Use event drilldown to review an anomaly's raw events
Use event drilldown on the Anomaly Details page to review raw events in Splunk Enterprise that led to anomaly creation in Splunk UBA. Event drilldown is only available for anomalies generated by models, not for rule-based anomalies.
Event drilldown creates a machine-generated SPL which serves as a starting point for your investigation into events that contributed to the anomaly. In this current search, Splunk UBA identifies the data sources, users, devices, and associated metadata to form the SPL. Use the SPL that is generated as a starting point for your searches. It is expected that you will need to adjust your search based on contextual information in the anomalies. The initial machine-generated SPL helps you to avoid having to write the SPL from scratch.
Prerequisites for using event drilldown
Verify the following before you are able to use event drilldown:
- Splunk UBA must be connected to Splunk Enterprise. Follow the instructions in Connect Splunk UBA to Splunk Enterprise to view an anomaly's raw events to define the search heads and search head clusters in your Splunk Enterprise deployment.
- Any Splunk UBA user with any role can review an anomaly's raw events in Splunk Enterprise using their own credentials. The person viewing the events does not have to be the same person who on-boarded the data into Splunk Enterprise. However, in some cases, the generated URL may be too long to be processed by the Splunk HTTP server. If this happens, perform the following tasks:
- Set the following property in the
/etc/caspida/local/conf/uba-site.propertiesfile in Splunk UBA:triggering.event.search.backend.submission = true
- In distributed deployments, synchronize the cluster:
/opt/caspida/bin/Caspida sync-cluster /etc/caspida/local/conf
- Restart the job manager:
sudo service  caspida-jobmanager stop
sudo service  caspida-jobmanager start
uba_. See Manage user accounts and account roles in Splunk UBA. - Set the following property in the
Where do I see event drilldown?
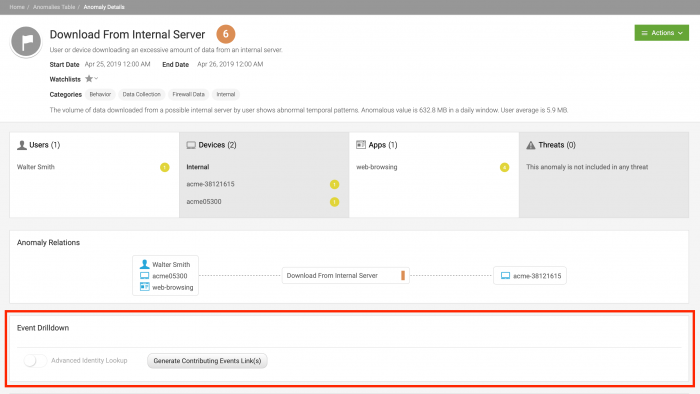
The Event Drilldown panel appears on the Anomaly Details page. The following example shows the Event Drilldown panel for the Download from Internal Server anomaly, which is generated by an offline model:
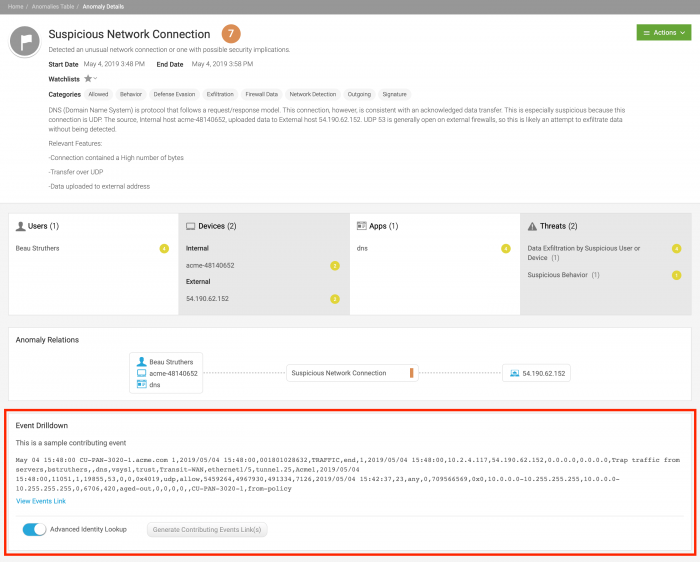
The Event Drilldown panel for anomalies generated by streaming models such as Suspicious Network Connection are populated with a sample event, as shown in the example below:
Use and configure event drilldown
To use event drilldown, perform the following tasks:
- Click Generate Contributing Events Link(s) to generate a link called View Events Link. Splunk UBA pre-calculates this link for certain types of anomalies so that View Events Link is visible when the Anomaly Details page is loaded for the first time. See Splunk UBA caches SPL for important anomalies.
- Click View Events Link to view raw events in Splunk Enterprise and begin your investigation. The Generate Contributing Events Link(s) button is inactive and will remain this way unless you change the Advanced Identity Lookup toggle. See Use Advanced Identity Lookup.
When there are events coming from search heads in multiple search head clusters to generate an anomaly, you will see multiple View Events Link links after you click Generate Contributing Events Link(s).
When you click on View Events Link, an SPL query is automatically generated using relevant data from the anomaly, including username, email ID, IP addresses (internal and external), host names (if available), and time range. Use this query to collect more supporting evidence from Splunk Enterprise. In environments with search heads in multiple clusters, each View Events Link link generates its own SPL query.
The first line of the generated SPL is used for event drilldown and cannot contain any macros or filters to subsearches such as [| inputlookups ...].
Make sure that the configured datasource SPL doesn't have the first PIPE (sub search query) inside the square parenthesis.
Perform the following steps if you need to edit your SPL:
- Always wrap the square parenthesis with "( and )" wherever it's possible.
Example:(index=*default sourcetype=newdatasource) NOT ([| inputlookup logging1.csv]) NOT ([| inputlookup logging2.csv]) NOT ([| inputlookup logging3.csv | rename dest as src]) | eval action="allowed", eventtype=category | fields action,alarmCategories,bytes,bytes_in,bytes_out,category, dest_host,dest_ip,dest_port,duration,eventtype, ids_type,severity,signature,sourcetype,src_host,src_ip,src_port,tag,user - Log in to the Splunk UBA management node.
- Restart the job manager.
sudo service caspida-jobmanager stop
sudo service caspida-jobmanager start
Splunk UBA caches SPL for important anomalies
Splunk UBA caches the SPL for important anomalies. Raw events for the following types of anomalies are pre-populated and cached in Splunk UBA. When you load the Anomaly Details page, the View Events Link link is already visible for anomalies in either of the following categories:
- Anomalies included in a threat
- Anomalies with a score of 8 or higher
You can adjust the anomaly score threshold by performing the following tasks:
- Configure the
triggering.event.pre.calculate.links.anomaly.thresholdproperty in the/etc/caspida/local/conf/uba-site.propertiesfile to adjust the anomaly score threshold. The default is 8. As an example, you can set the threshold to 9 if you only want anomalies with a score of 9 or higher to be pre-populated and cached in Splunk UBA. - In distributed deployments, synchronize the cluster:
/opt/caspida/bin/Caspida sync-cluster /etc/caspida/local/conf
- Restart the job manager:
sudo service  caspida-jobmanager stop
sudo service  caspida-jobmanager start
Use Advanced Identity Lookup
Enable the Advanced Identity Lookup toggle to view the original IDs in the raw events instead of the Splunk UBA entity name. For example, instead of seeing the resolved device name of jsmith-laptop, you want to see the actual IP address of the device instead to aid in your investigation.
If you have already generated a View Events Link by clicking Generate Contributing Events Link(s) and the Generate Contributing Events Link(s) is inactive, changing the Advanced Identity Lookup toggle makes the Generate Contributing Events Link(s) active again. You can click on Generate Contributing Events Link(s) to generate new links.
- Splunk UBA requires up to two hours to generate advanced identity data for events. If an anomaly is not yet two hours old, this toggle is disabled until the anomaly is more than two hours old.
- When the toggle is enabled, identity data from the past 7 days is used to view contributing events. If an anomaly is more than 7 days old and event drilldown links have not been calculated before, this toggle is disabled and cannot be changed.
- For anomalies that already have calculated links, the toggle appears in the position that was used to generate the links. You can change the toggle position and generate new links.
Configure properties to increase the timeout interval
If you see a "Triggering Event time out" error message, perform the following tasks:
- Adjust the time out value in the
triggering.event.timeout.millisproperty in the/etc/caspida/local/conf/uba-site.propertiesfile. The default timeout value is 5 minutes, or 300,000 milliseconds. - In distributed deployments, synchronize the cluster:
/opt/caspida/bin/Caspida sync-cluster /etc/caspida/local/conf
- Restart the job manager:
sudo service  caspida-jobmanager stop
sudo service  caspida-jobmanager start
Configure reverse IR to view contributing events
Identity resolution (IR) allows Splunk UBA to perform real-time identity resolution to accurately define users and devices. Reverse IR enables you to view the contributing events for the IP address of a device even if the device name is resolved through IR. However, reverse IR generates additional overhead on the system and can affect performance when viewing contributing events, potentially leading to timeouts.
Reverse IR is enabled by default. To disable reverse IR, perform the following steps:
- Set the
triggering.event.enable.reverse.irproperty in the/etc/caspida/local/conf/uba-site.propertiesfile tofalse:triggering.event.enable.reverse.ir = false
- In distributed deployments, synchronize the cluster:
/opt/caspida/bin/Caspida sync-cluster /etc/caspida/local/conf
- Restart the job manager:
sudo service  caspida-jobmanager stop
sudo service  caspida-jobmanager start
| Review anomalies on the anomalies table | See all users on the user table |
This documentation applies to the following versions of Splunk® User Behavior Analytics: 5.0.0, 5.0.1, 5.0.2, 5.0.3, 5.0.4, 5.0.4.1, 5.0.5, 5.0.5.1, 5.1.0, 5.1.0.1


 Download manual
Feedback submitted, thanks!