Configure Splunk UBA
Configure Splunk UBA to provide more accurate and specific anomaly and threat detection. As needed, perform these configurations before adding data to Splunk UBA. Not all configuration changes are needed for all deployments.
In a distributed deployment, make the configuration changes on the management server and deploy the changes to the other servers after your changes are complete. See Deploy configuration changes to other servers.
How to use the Settings window
Splunk UBA configuration options are available from Splunk UBA by accessing the Settings window under Manage > Settings.
In most cases, Splunk UBA is restarted each time you click OK in the Settings window. Make all desired configuration changes in the Settings window before you click OK.
After Splunk UBA is restarted, you can check the system status to validate that you made all required configurations. See Check system status before and after installation.
Set internal IP range and associated office locations
Specify the IP range used internally in your organization, using CIDR format to reference the top-level internal IP blocks. This is required to allow Splunk UBA to identify which machines are internal to your network and accurately identify external IP networks. Network traffic internal to your organization is processed differently from external network traffic, and different anomalies and threats are created as a result. If the list of internal IP address ranges is incomplete, you can miss anomalies and threats.
You can also associate the CIDR IP ranges with office locations. This information is used to create accurate anomalies and help visualize internal device locations. If your company has multiple office locations and IP ranges assigned to specific locations, use multiple lines to associate each IP address range with an office location. Use one line for each IP address range, even if they all apply to the same location. This internalGeoAttributions parameter takes precedence over the default office location set in uba-site.properties.
Splunk UBA supports:
- A maximum of 40,000 IP CIDR blocks or IP addresses.
- A maximum of 40,000 internal geolocations.
Exceeding these limits can negatively affect Splunk UBA's performance. See below for an example and more details.
- Look up the latitude and longitude of the office locations.
- From the command line, open the configuration directory.
cd /etc/caspida/local/conf/etl/configuration
- Open the
/etc/caspida/local/conf/etl/configuration/EntityValidations.jsonfile in an editor and fill out the empty set for theinternalIPRange. For example:"internalIPRange" : ["199.79.0.0/16","220.200.0.0/16"]
The private IP ranges
"10.0.0.0/8", "172.16.0.0/12", "192.168.0.0/16", as specified by RFC1918, along with"127.0.0.0/8", "169.254.0.0/16", are already scoped as Internal by default and need not be added to this file. - (Optional) Fill out the empty set for the
internalGeoAttributionsto assign the IP ranges to the office locations. For example, to associate four IP address CIDR ranges with San Jose, New York, and Dallas office locations, assign the locations like the following example:
  "internalGeoAttributions" : [
     {"cidr": "10.0.0.0/8", "location": {"city": "San Jose", "countryCode": "US", "latitude": 37.3382, "longitude":-121.8863}},
     {"cidr": "172.16.0.0/16", "location": {"city": "New York", "countryCode": "US", "latitude":40.788614 , "longitude":-73.9696091}},
     {"cidr": "192.168.0.0/16", "location": {"city": "Dallas", "countryCode": "US", "latitude": 32.8208751, "longitude":-96.8714253}},
     {"cidr": "199.79.0.0/16", "location": {"city": "San Jose", "countryCode": "US", "latitude": 37.3382, "longitude":-121.8863}}
  ]
If you choose to perform this optional step, be sure to end the preceding
internalIPRangeblock with a comma (,) character at the end of the line. - Save your changes.
- Run the following command to validate the JSON in the
EntityValidations.jsonfile:/opt/caspida/bin/status/check_entity_validations.sh -v
A sample output from this command is shown below:
/etc/caspida/local/conf/etl/configuration/EntityValidations.json: parsed successfully
  #internalIPRanges: 7
  #internalGeoAttributions: 2

This utility merges JSONs from internal & /etc/caspida/local/conf/etl/configuration/EntityValidations.json
  Make sure you run: Caspida sync-cluster to copy the /etc/caspida/local/conf/etl/configuration/EntityValidations.json to all nodes in the cluster
See Deploy configuration changes to other servers in a distributed deployment for instructions on running the
sync-clustercommand.
If data ingestion has already started, stop and start the data sources on the Data Sources page for the changes to take effect.
Set default office location
Set the default location for your office, if applicable, to allow Splunk UBA to display the appropriate location for location-based visualizations. Make this configuration change in order for geolocation visualizations in Splunk UBA to be accurate.
- Look up the latitude and longitude of your address.
- In Splunk UBA, select Manage > Settings.
- Select Geo Location.
- Specify the latitude and longitude of your address.
- Specify a name for this address (the default is "Internal Network").
- Select Show Geo Maps to use location-based visualizations in Splunk UBA.
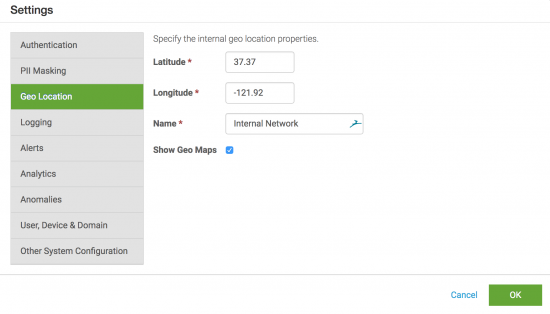
- Update any other settings you want to configure. Otherwise, click OK to restart Splunk UBA.
Only Splunk UBA is restarted when you click '''OK'''.

Configure additional logging for Splunk UBA activities
By default, the log files for Splunk UBA exclude user activity in the following areas:
- Postgres
- Impala
- Influx
- JobManager
To log additional details for user activity in Splunk UBA in these areas, perform the following tasks:
- In Splunk UBA, select Manage > Settings.
- Select Logging.
- Select the desired items you want to log.
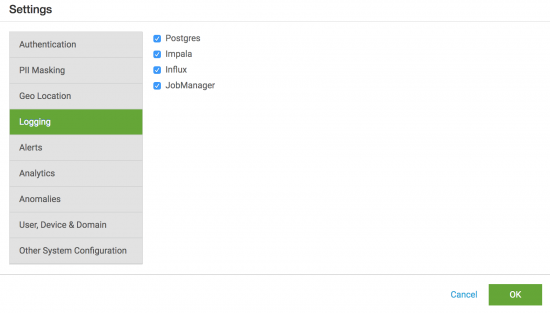
- Update any other settings you want to configure. Otherwise, click OK to restart Splunk UBA.
Only the Splunk UBA user interface is restarted when you click '''OK'''.

The Splunk UBA log files, along with log files for other UBA components, can be downloaded using System > Download Diagnostics. Make sure the UI option is selected to download diagnostics data for Splunk UBA.

See Collect diagnostic data from your Splunk UBA deployment.
Configure email alerts to your Splunk UBA deployment administrators
You can set up email alerts to the administrators of your Splunk UBA deployment. If you set this up, the system sends emails when it detects a severe system-related event, such as a full hard disk or if event processing stops.
Do not send these system-level emails to your data scientists, research teams, or security analysts. Appropriate threat and anomaly data can be sent to your data scientists, research teams, or security analysts by configuring your email server as an output connector. See Send Splunk UBA threats to analysts using email.
Prerequisite for configuring email alerts in Splunk UBA
Set up the email output connector so that Splunk UBA can send email. See Set up the email server as an output connector.
Steps for configuring email alerts in Splunk UBA
To configure email alerts in Splunk UBA, perform the following tasks:
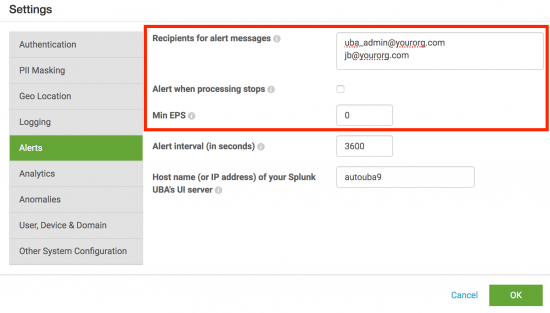
- In Splunk UBA, select Manage > Settings.
- Select Alerts.
- List the desired recipients separated on separate lines. For example, to send email alerts to
uba_admin@yourorg.comandjb@yourorg.com, enter each email address on a separate line. - To send an email if event processing stops, select Alert when processing stops.
- Configure a minimum EPS in the Min EPS field. An email is sent when the EPS falls below the configured threshold.
- Configure an alert frequency interval in seconds in the Alert interval (in seconds) field.
- Update any other settings you want to configure. Otherwise, click OK to restart Splunk UBA.

Specify the host name of your Splunk UBA server
Configure the host name or IP address of the Splunk UBA server. This setting is required by Splunk Enterprise Security for viewing contributing anomalies in Splunk UBA.
- In Splunk UBA, select Manage > Settings.
- Select Alerts.
- Specify the host name or IP address of the Splunk UBA server in the Host name (or IP address) of your Splunk UBA's UI server field.
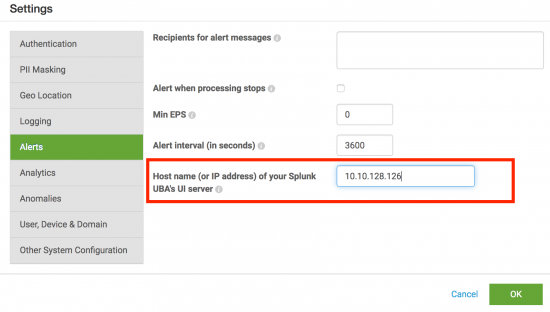
- Update any other settings you want to configure. Otherwise, click OK to restart Splunk UBA.

Add a list of your competitors
To identify when users interact with competitor websites or email addresses, add a list of competitor email domains to Splunk UBA.
- In Splunk UBA, select Manage > Settings.
- Select ETL & Analytics.
- In the Competitor Domains field, type a list of domain names separated by line breaks. For example, to identify when users interact with competitors of your organization, such as Splunk and Example Company, enter
splunk.comandexample.comon separate lines:
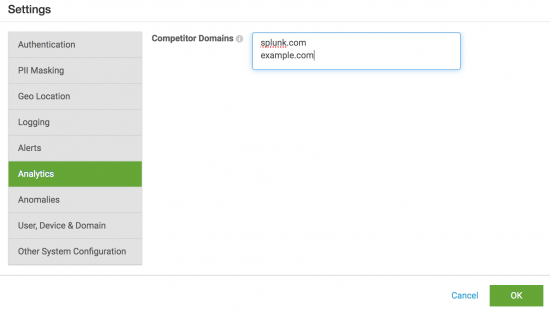
- Update any other settings you want to configure. Otherwise, click OK to restart Splunk UBA.

Splunk UBA uses the information in the file to create anomalies when events indicate that employees are interacting with competitors.
Connect Splunk UBA to Splunk Enterprise to view an anomaly's raw events
Connect Splunk UBA to your Splunk Enterprise search head to drill down from the anomaly details to view some specific events in Splunk Enterprise that caused an anomaly to be raised in Splunk UBA. See Use Event Drilldown to review an anomaly's raw events.
To connect Splunk UBA to Splunk Enterprise to view an anomaly's raw events, perform the following tasks:
- In Splunk UBA, select Manage > Settings.
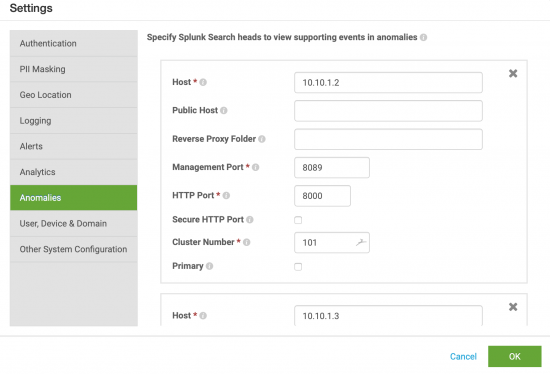
- Select Anomalies.
- Click Add New to add a single search head. Specify the following information:
Parameter Description Host The host machine, such as the host part of the URL when creating the datasource. If a Public Host is specified, Splunk UBA submits the search to the link generated using the Public Host value. Use the fully qualified domain name (FQDN) when specifying the host, such as an IP address like 192.168.10.12 or server.examplecompany.com. Do not include https:// in the host name. Public Host The public IP/DNS of the host machine. This needs to be configured when working with AWS deployments. This can also be used to map the Host to a different server. For example, you can specify server1as the Host use by data sources to get data into Splunk UBA, and also specifyserver2running Splunk Enterprise as the Public Host to for the event drilldown links.Reverse Proxy Folder The root_endpointof Splunk Web if your environment hosts Splunk Web behind a proxy that does not place Splunk Web at the proxy's root. See Use Splunk Web with a reverse proxy configuration.Management Port The port that the Splunk Enterprise data sources use to talk to splunkd. This is normally the port of the URL specified when creating the data source. By default, the management port uses HTTPS.HTTP Port The port used to access Splunk Web. Secure HTTP Port Click the checkbox to use HTTPS instead of HTTP to access Splunk Web. If you choose to use HTTPS, you must also change the port number in the HTTP Port column to match your HTTPS port, such as 443. Cluster Number Number representing the cluster where the search head is located. All search heads returning results from the same indexer are considered to be part of the same cluster. Only numerical values are supported.
Use 1 to represent the first search head you connect to Splunk UBA. If you have a second search head returning results from a different indexer, use 2 to represent that second search head, then 3 for the third, and so on.Primary Click the checkbox to make this search head the primary dedicated search head. Splunk UBA will always send searches to this search head. Splunk UBA can ingest data from multiple Splunk search heads in multiple clusters. This configuration allows you to specify the Splunk search heads and clusters that should be used. Without this, Splunk UBA assumes all Splunk search heads are part of a single cluster.
Use a third-party hardware or software load balancer in front of your set of clustered search heads to access the set of search heads through a single interface, without needing to specify a particular one. Configure the load balancer so that user sessions are "sticky" or "persistent" to remain on a single search head throughout the session. See Use a load balancer with search head clustering in the Splunk Enterprise Distributed Search manual.
- Update any other settings you want to configure. Otherwise, click OK to restart Splunk UBA.

Define the AD domains in use for devices
Set the domains that you want to have Splunk UBA designate as internal, and normalize device names to use only their short name.
Get a list of all internal domains
Get a list of all internal domains in your environment. After you identify your internal domains, enter the domains into the Settings window. Splunk UBA treats all domains not listed here as external domains.
Use the following search to parse Windows 4624 (logon) events logged from the Splunk Add-on for Microsoft Windows:
sourcetype=XmlWinEventLog source=XmlWinEventLog:Security EventCode=4624 Computer=*
| rex field=Computer "^[^.]+.(?<deviceDomains>\S+)"
| stats latest(_time) by deviceDomains
| table deviceDomains
If you are using a version of the Splunk Add-on for Microsoft Windows older than 6.0.0, use the following search instead:
sourcetype="WinEventLog:Security" EventCode=term(4624) earliest=-7d@d ComputerName="*.*"
| rex field=ComputerName "^[^.]+.(?<deviceDomains>\S+)"
| stats latest(_time) by deviceDomains
| table deviceDomains
Set internal domains
All devices created using a Fully Qualified Domain Name (FQDN), such as host.example.com or www.sf.example.com, are considered external devices by default. You can configure them to be internal domains by using the settings in Splunk UBA.
- In Splunk UBA, select Manage > Settings.
- Select User, Device & Domain.
- In the Internal domains field, specify a list of internal domains on separate lines.
Do not remove the
localandlocaldomainentries.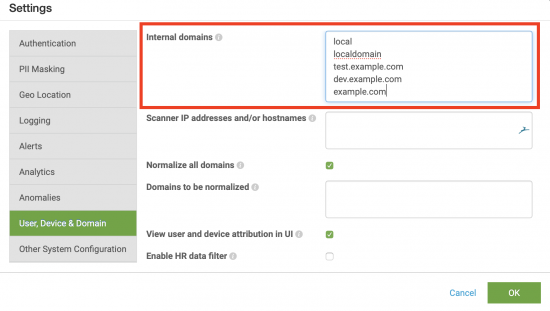
A longest suffix match is used to identify matching devices. For example, defining the internal domains as:
local
localdomain
test.example.com
dev.example.com
example.com
means that
test.example.com,dev.example.com, andexample.comare created as internal devices. If the property setting is changed to the following:thenlocal localdomain test.example.com example.com
dev.example.comis created as external, whiletest.example.comandexample.comare created as internal. - Update any other settings you want to configure. Otherwise, click OK to restart Splunk UBA.

Normalize device names
Normalize device names so that Splunk UBA accurately identifies devices and reduces the number of unique devices created in Splunk UBA when processing events. Events can refer to the same device in different ways: one event may refer to a network router in your environment as router1, while another event may refer to the same router as router1.example.com. Without normalization, two separate device identifiers are created for the same device. By normalizing device names (domains), Splunk UBA can identify a device referred to by different names and create a single device, such as router1.
Normalization must not be applied to different devices with the same host name. For example, router1.example.com and router1.sf.splunk.com are two different devices despite having the same device name. Normalization is configured or deactivated for such cases.
By default, all device names are normalized (truncated) to their host (short) name only, so as an example, host.example.com is normalized to host. No configuration change is needed to enable device name normalization.
To normalize a portion of your domains:
- In Splunk UBA, select Manage > Settings.
- Select User, Device & Domain.
- Deselect the checkbox in Normalize all domains.
- In the Domains to be normalized field, specify the AD domains you want to normalize. If specifying multiple domains, use a separate line for each domain. For example:
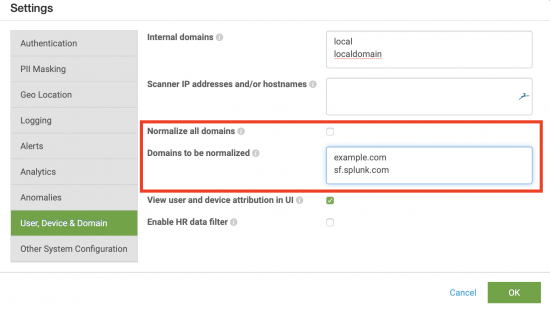
In this example, only device names created from domains ending inexample.comandsf.splunk.comwill be normalized, according to the longest matching suffix. - Update any other settings you want to configure. Otherwise, click OK to restart Splunk UBA.

Exclude IP scanner activity from creating unnecessary devices in Splunk UBA
Perform the following tasks to exclude IP scanner activity from creating unnecessary unresolved devices in your environment.
- In Splunk UBA, select Manage > Settings.
- Select User, Device & Domain.
- In the Scanner IP address and/or hostnames field, define the host names and domains you want to exclude from being created as devices, as shown in the following example:
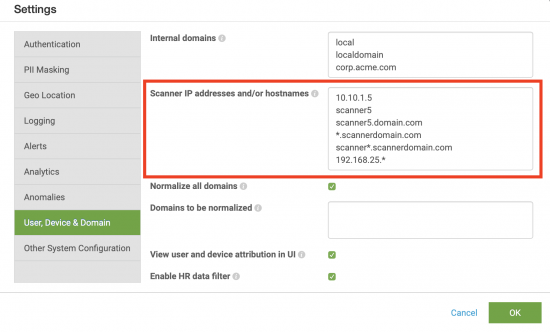
- Update any other settings you want to configure. Otherwise, click OK to restart Splunk UBA.

You can specify the following types of values:
- A complete IP address
- A host name
- A fully qualified domain name (FQDN)
- A regular expression. If needed, use the asterisk (*) as a wildcard character.
The following table describes the values provided in the example:
| Value | Description |
|---|---|
| 10.10.1.15 | Excludes the host with the IP address 10.10.1.15 from being created as a device.
|
| scanner5 | Excludes the host with the short name of scanner5 from being created as a device.
|
| scanner5.scannerdomain.com | Excludes the host with the FQDN scanner5.scannerdomain.com from being created as a device.
|
| *.scannerdomain.com | Excludes all hosts with scannerdomain.com as part of the FQDN from being created as devices.
|
| scanner*.scannerdomain.com | Excludes all hosts with scanner as the first part of their host name followed by scannerdomain.com from being created as devices.
|
| 192.168.25.* | Excludes all hosts with 192.168.25. as the first part of their IP address (equivalent to 192.168.25.0/24 from being created as devices.
|
There is no limit to the number of values that can be specified in the field.
Hide user and device attribution in Splunk UBA
User and device attribution shows the relationship between a user and associated devices, like a corporate laptop or mobile phone. User and device attribution is displayed by default in the device and user detail pages.
If you want to hide user and device attribution in Splunk UBA due to concerns about system performance, perform the following tasks:
- In Splunk UBA, select Manage > Settings.
- Select User, Device & Domain.
- Deselect the checkbox in the View user and device attribution in UI field.
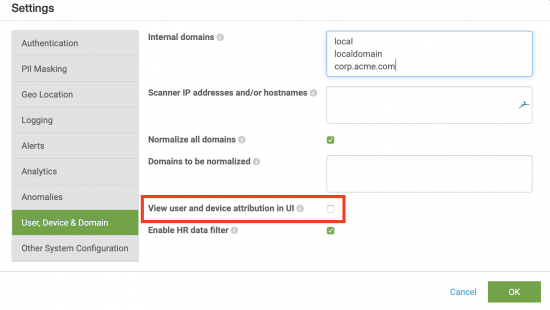
- Update any other settings you want to configure. Otherwise, click OK to restart Splunk UBA.

Verify that the HR data filter is enabled
By default, an HR data filter is enabled and Splunk UBA only ingests data related to users in your HR data. This means that only events for which the Splunk UBA Identity Resolution module can identify a human user are examined for anomalies. Splunk UBA ignores any events for which accounts are not able to be resolved to a human user. If this configuration is disabled, then all events are processed for anomaly detection.
The HR data filter is a global filter and takes precedence over existing event filters. Do not disable this filter unless directed to do so by Customer Support.
See Why Splunk UBA requires HR data for more information about the importance of HR data.
To verify that the HR data filter is enabled:
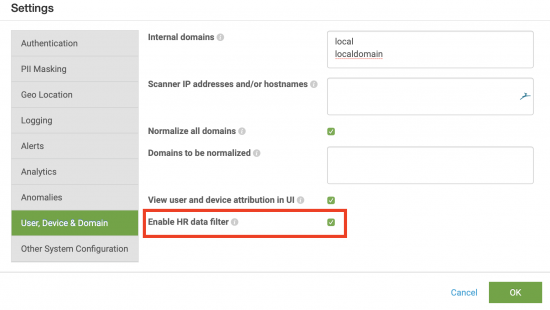
- In Splunk UBA, select Manage > Settings.
- Select User, Device & Domain.
- Verify that the checkbox in the Enable HR data filter field is selected.

Run Splunk UBA as a non-root user
If you want to run Splunk UBA as a non-root user on the server, such as caspida or other non-root user, perform the following configuration changes. You must change the port that Splunk UBA uses to be a port above 1024.
- In Splunk UBA, select Manage > Settings.
- Select Other System Configuration.
- In the HTTPS Port field, define the new port that you want to use to access Splunk UBA. For example, to use port 9443:
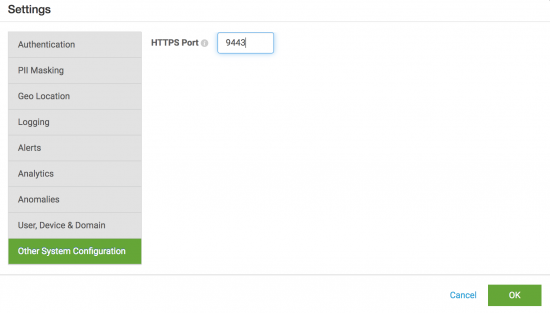
- Update any other settings you want to configure. Otherwise, click OK to restart Splunk UBA.
- Make firewall changes so that you can access Splunk UBA.
System Procedure Splunk UBA running on Ubuntu: - Log in to the Splunk UBA management server as the caspida user using SSH.
- Run the following commands, replacing the
<port_number>with the port number that you want to use.sudo ufw allow <port_number>/tcp
sudo ufw reload
Splunk UBA running on supported Linux 6.x systems: - Log in to the Splunk UBA management server as the caspida user using SSH.
- Run the following commands, replacing the
<port_number>with the port number that you want to use.sudo iptables -A INPUT -p tcp --dport <port_number> -j ACCEPT
sudo service iptables save
Splunk UBA running on supported Linux 7.x systems: - Log in to the Splunk UBA management server as the caspida user using SSH.
- Run the following commands, replacing the
<port_number>with the port number that you want to use.sudo firewall-cmd --permanent --zone=public --add-port=9443/tcp
sudo firewall-cmd --reload
- Restart Splunk UBA and the resource monitor service. Run the following commands:
sudo service caspida-ui stop
sudo service caspida-ui start
sudo service caspida-resourcesmonitor stop
sudo service caspida-resourcesmonitor start

Deploy configuration changes to other servers in a distributed deployment
Clicking OK in the Settings window will distribute configuration changes to the other servers in your deployment.
However, there may be other cases when distributing configuration changes throughout the cluster is necessary, such as making changes to the EntityValidations.json file. To distribute configuration changes to the other servers in your deployment outside of the Settings window, perform the following tasks:
- Log in to the management server of Splunk UBA as the caspida user using SSH.
- Run the following command to sync the configuration changes across your deployment.
/opt/caspida/bin/Caspida sync-cluster /etc/caspida/local/conf
| Verify a successful upgrade of Splunk UBA | License Splunk UBA |
This documentation applies to the following versions of Splunk® User Behavior Analytics: 5.0.0, 5.0.1, 5.0.2, 5.0.3, 5.0.4, 5.0.4.1
Feedback submitted, thanks!