Review current threats
Splunk UBA detects threats based on anomalous activity. Review the active threats in your environment and take targeted actions to remediate those threats.
Filter the threats displayed in the Threats Table
View the Threats Table to see a summary of the threats in your system. You can filter the threats that are displayed in the Threats Table.
Follow these steps to access the Threats Table:
- From the Splunk UBA navigation menu, select Explore > Threats . Alternately, just click Threats on the Splunk UBA home page.
- Click Add Filter to limit the threats displayed in the Threats Table. You can filter by any combination of the following criteria:
- Threat information, such as score, category, or status.
- Entities involved in the threat, such as users, devices, accounts, apps, and domains.
- Anomalies involved in the threat.
Filters are applied immediately without having to save any settings. You can click Save to save the filtered display as a preset display. You can then select it from the Threats Table list of presets without having to re-configure the filters.
Filters are applied across all threat pages, including Threats Review and Threats Dashboard.
For example, follow these steps to filter the Threats Table to only view closed threats:
- Navigate to the Threats Table.
- Click Add Filter.
- Select Threat Status.
- Select Closed By System and Closed By User. See How Splunk UBA threats are closed for more information about how and why Splunk UBA threats are closed.
Threats Review
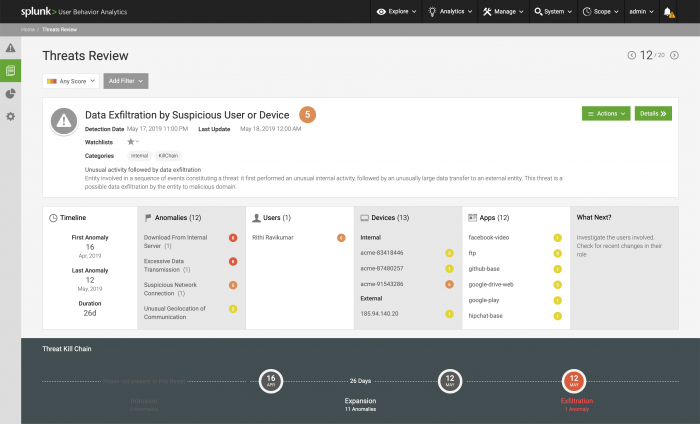
Select Threats Review from the Splunk UBA home page to review the current threats detected in your environment. Threats Review displays threats one at a time, ordered by risk score. The most urgent, more recent, and highest-risk threats display first. This lets you focus on the most severe threats first.
You can see the total number of threats, and select from the available filters to configure your Threats Review page.
Threats Review includes the following information:
Not all panels appear for all threats. For example, if a threat is not derived from a kill chain-based correlation model, then the Threat Kill Chain panel does not appear.
| Field or panel name | Description |
|---|---|
| Top panel | Review the threat type, description, and risk score. The higher the score, the greater the risk to your environment. |
| Timeline | Review the timeline to see when the threat first appeared, the start date, the last time the threat was detected, and the last update. |
| Associated anomalies | Review the associated anomalies. Select one to view the threat details filtered on the threat-specific anomalies. |
| Associated users, devices, apps, or domains | Review the associated users, devices, apps, or domains. Select one to view the related information page. |
| What's Next | Determine what action to take next based on the What's Next panel. |
| Threat Kill Chain | Identifies the phases of the kill chain and whether the phase is present for that threat. Use this panel to better understand the threat progression through your organization. To see more details on the kill chain, select Details to open Threat Details. |
Take action on a threat
You can choose to take action on the threat:
- Click Watchlists beneath the name of the threat to add it to a watchlist, like a threat watchlist. You can also classify the threat as a False Positive or note that it is Important, Reviewed, or select Save for Later to save the threat to review it later.
- If the threat is not a real threat, select Actions > Not a Threat and select a reason or provide a comment for closing the threat. See Close threats in Splunk UBA.
- Send the threat somewhere for further investigation or to share it with others. Select Actions to send the threat to another system.
- Send the threat via email to other analysts. Select the option to Attach HTML if you want to include the threat details page with the threat. To set up the email output connector, see Send Splunk UBA threats to analysts using email in Administer Splunk User Behavior Analytics.
- If you have a ServiceNow or Splunk Enterprise Security integration configured, you can also Export to ServiceNow or Export to SplunkES. See Send threats from Splunk UBA to ServiceNow and Send Splunk UBA threats and anomalies to Splunk Enterprise Security in Administer Splunk User Behavior Analytics.
Threat Details
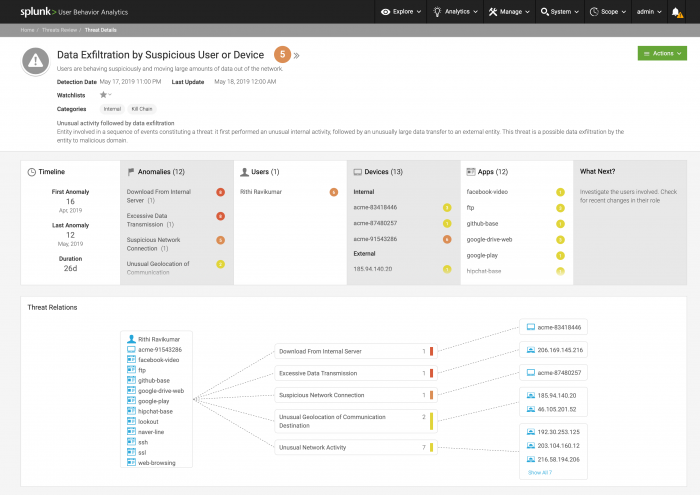
See the Threat Details of a threat by selecting Details on the Threats Review page.
The following image shows a Threat Details page, populated with example data:
Threat Details includes the following information:
Not all panels appear for all threats.
| Field or panel name | Description |
|---|---|
| Last Update | Corresponds to the date of threat revalidation or threat rescoring. A threat might be periodically rescored or revalidated after its creation. This might happen if an action is taken on a threat's associated entities or anomalies, for example if an anomaly associated with the threat is deleted or rescored. For example, May 18, 2019 12:00AM. |
| Threat Details | Each threat displays a short and a long description. Read the description to learn more about the type of threat and remediation steps. For example, "Users are behaving suspiciously and moving large amounts of data out of the network." |
| Risk score | The higher the risk score, the greater the threat. Click the risk score to learn more about the factors contributing to the score. For example, 5. |
| Threat Relations | Review the interaction of users, devices, domains and/or apps in this threat. Each dotted line represents one or several anomalies connecting users, devices, domains and/or apps. The color of the line corresponds to the highest-risk anomaly in the group of anomalies. |
| Kill Chain | View phases by date, phase, and duration, with the relevant anomalies, locations, and descriptions detailed for each phase. |
| Threat Anomalies Timeline | Shows the volume and risk level of each anomaly associated with the threat over time. |
| Threat Anomalies Trend | Can help you identify spikes in anomalous activity. Select the menu, then select Breakdown to see the threat trend graph broken down by anomaly type. |
| Threat Anomalies | View all anomalies associated with the threat in this panel. The anomalies are sorted by event date by default. Select the header title to reorder the table. You can search within the table, or download the listed anomalies to a CSV file. Select a specific anomaly to view the Anomaly Details, or click the username, device IP address, or app name to view the relevant info page. |
| Device Locations | Use the map to see the locations of the devices associated with the threat. Determine whether the devices are in their expected locations. The colors indicate the risk level of the anomalies associated with the devices. |
Anomaly Details
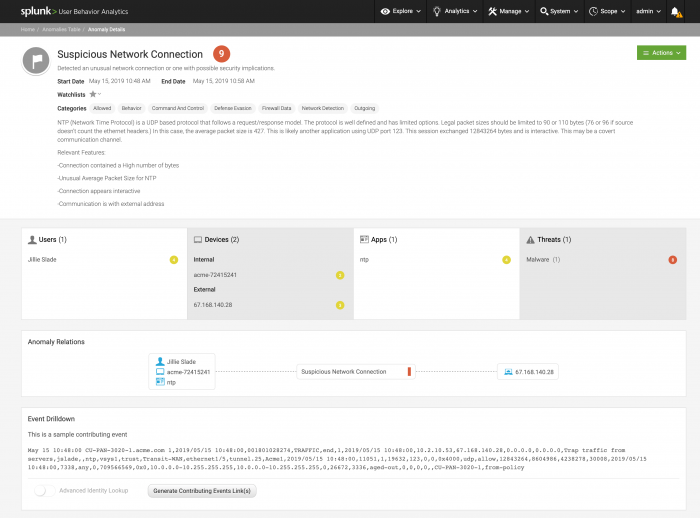
Select a specific anomaly to view the Anomaly Details dashboard. The Anomaly Details page displays an event date and a description.
Anomaly Details includes the following information:
Not all panels appear for all anomalies.
| Field or panel name | Description |
|---|---|
| Risk score | Each anomaly has a risk score. The higher the risk score, the greater the risk associated with the anomalous activity. |
| Users panel | The users involved in the anomaly, if any. Click a username to view the relevant information page. |
| Devices panel | The devices involved in the anomaly, if any. Click a device IP address to view the relevant information page. |
| Anomaly Relations | Review Anomaly Relations to see the interaction of users, devices, domains and apps in this anomaly. |
| Event Drilldown | As a hunter, use Event Drilldown to connect to Splunk Enterprise and review an anomaly's contributing raw events. See Use event drilldown to review an anomaly's raw events. |
| Supporting evidence | Each anomaly has different types of supporting evidence. For example, the Unusual Machine Access anomaly displays the common devices and users for the machine so that you can compare them against the anomalous access activity. The Malicious Domain anomaly shares the specific aspects of the domain and the risk that each of those aspects pose to your environment that led the model to determine that the domain is malicious. |
| Score Details | View the Score Details for information about how the anomaly score was calculated. Scoring rules for anomalies in Splunk UBA can be customized. See Customize anomaly scoring rules. |
| Anomaly Graph | Use the Anomaly Graph to see the interaction of devices and users. Click the + for a user or device to see additional users, devices, or anomalies associated with the user or device. The blue path indicates the most-commonly-followed path.
Only some anomalies have an anomaly graph. |
| Device Locations | If devices associated with the anomaly have location data, you can view them on the Device Locations map. |
| Additional Information | Review the log format of the anomaly as well as the model that detected the anomaly. |
Take action on anomalies
You can take action on an anomaly, and make changes based on the results of an investigation.
- Click Watchlists beneath the name of the anomaly to add the anomaly to a watchlist. For example, False Positive, Important, Reviewed, or a custom watchlist.
- Select Actions > change Score to change the risk score of an anomaly. Changes to the risk score apply only to the specific anomaly, and are not shared with the model that created the anomaly.
- Select Actions > Delete to delete an anomaly it if it was created in error. See Delete anomalies in Splunk UBA.
- Select Actions > View similar anomalies to open the anomalies table filtered by characteristics of the anomaly you are viewing.
| Investigate threats as a security analyst | View user information |
This documentation applies to the following versions of Splunk® User Behavior Analytics: 5.1.0, 5.1.0.1, 5.2.0, 5.2.1, 5.3.0, 5.4.0, 5.4.1


 Download manual
Feedback submitted, thanks!