Launch Splunk Web
You now have Splunk for VMware installed in your environment. You have it configured to collect data from the VMware resources you designated. The next step is to validate that you are collecting all the data you want and that the data is correct.
To check that the solution was installed correctly and that you are collecting the correct data from the correct resources, you can look at the dashboards in the Splunk App for VMware.
To do this:
- Check that Splunk is running in your environment.
- Open a browser and log into Splunk Web on your indexer/search head. Use the host and port you chose during installation. The default port is 8000 of the host on which it's installed. If you are using Splunk on your local machine, the URL to access Splunk Web is
http://localhost:8000. - Log in to the Splunk instance (the default login is username=admin/password=changeme).
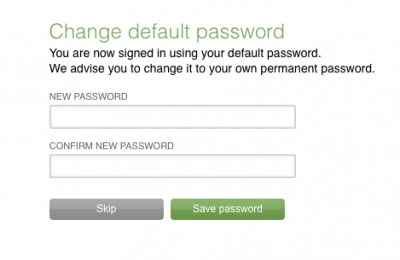
- If you are using an Enterprise license, launching Splunk for the first time takes you to this login screen. Follow the message to authenticate with the default credentials:
- When you sign in with your default password, Splunk asks you to create a new password. You can either Skip this or change your password to continue.
- If you are using a Free license, you do not need to authenticate to use Splunk. In this case, when you start up Splunk you won't see this login screen. Instead, you will be taken directly to Splunk Home or the default App for your account.
- In Splunk Home, select the Splunk App for VMware. Mapping the data from Splunk to the dashboards and views in the App can take a few minutes.
- Look at the data health views and check that they are populated with the correct data. If the data does not display correctly in the dashboards you can examine your
inputs.conffile for errors. How quickly the views are populated with data depends on the amount of data coming into Splunk. Populating the dashboards can take some time.


Check the Solutions Administration views
The data health views in the Solution Administration Dashboard provide metrics on the health of the data in Splunk. Examine each of the views associated with data you are collecting fom your environment; You should check inventory, hierarchy, time, performance, and log data in the app for the given VC and ESX/i hosts.
Check the Time Data Health Overview view to see if your FA or any of your ESX/i servers show up with an unacceptable time difference. If some do not, the clock on that host is most likely set incorrectly. If the time is set incorrectly, you must fix the time on all of your hosts for the solution to work correctly. If you had to reset the time on your FA, restart the forwarder inside it, wait for a few minutes, and then verify that you are seeing an acceptable time in the Time Health view.
Check the VMware Data Health views: When you have verified the time for the FA and all of your ESX/i hosts, then check to see that all of the different kinds of data in the solution are being captured properly. Check each of the various data health views:
- Inventory
- Tasks
- Events,
- ESX / ESXi logs
- Performance
It can take time for the views to populate especially if you have a large environment collecting many different types of data. Give the dashboards some time to load the data before you start troubleshooting.
| Obfuscate passwords | Is data coming in |
This documentation applies to the following versions of Splunk® App for VMware (Legacy): 1.0, 1.0.1, 1.0.2, 1.0.3
Feedback submitted, thanks!