Splunk App for Anomaly Detection workflow
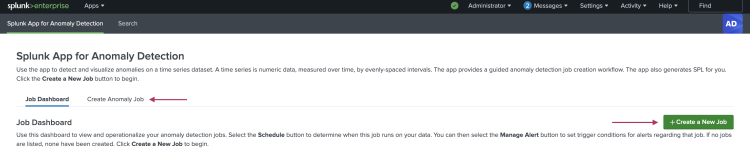
You can use the Splunk App for Anomaly Detection to benefit from machine learning insights on time-series data without having to immerse yourself in machine learning practices and methodologies. The app provides a guided anomaly detection job creation workflow and a job dashboard from where you can manage and operationalize those jobs.
The Splunk App for Anomaly Detection works with any time-series dataset that you can ingest into the Splunk platform. A time-series is numeric data, measured over time, by evenly spaced intervals. The app also generates SPL for you.
Similar to other Splunk applications, the CPU and memory resources the app consumes are commensurate with the size of the datasets you use.
Create a new anomaly detection job
Perform the following steps to create a new anomaly detection job:
- Open the Splunk App for Anomaly Detection and choose the Create Anomaly Job tab or the Create a New Job button.
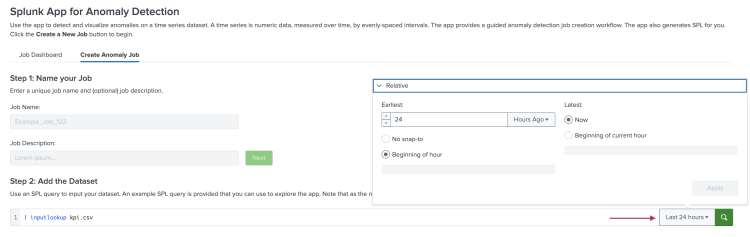
- Input a job name and optionally add a job description. Job names must be unique and alphanumeric. Job names can include underscores but cannot include spaces, special characters, or have a digit as the first character.
The job name cannot be changed once created.
Click Next when ready.
- Use an SPL query to load the time-series dataset on which you want to perform anomaly detection. Optionally use the pre-populated sample dataset to explore the app before working with your own data.
The number of fields in the dataset can impact app response time.
Click enter or return on your keyboard, or the magnifying glass icon on the search bar when ready.
- Optionally adjust the time-frame for the anomaly detection job from the time-range picker. The Last 24 hours is selected by default. Click enter or return on your keyboard, or the magnifying glass icon on the search bar when ready.
- Your dataset displays in a Preview Data panel and you can now select a field from that dataset for anomaly detection. From the Field for Detection drop-down menu, choose a field.
The drop-down menu is filtered to only display the numeric fields in your queried dataset.
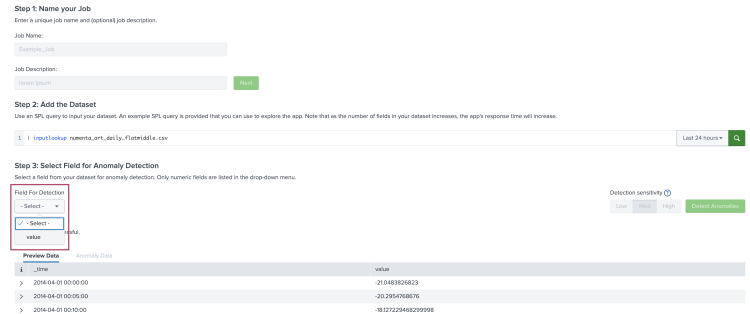
- Once you select a field, the app performs a data health diagnostic check. These diagnostics determine if the data is well-suited for anomaly detection.
- If your dataset passes the health diagnostic check, you see a preview visualization of the data and can proceed to step 6.
- If your dataset is missing values or the timestamps are not evenly distributed, it will not pass the health diagnostic check and you see steps to remediate. After completing the following remediation steps, proceed to step 6.
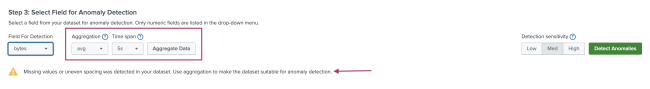
- Aggregation: Choose an aggregate function from the drop-down menu to summarize the value you selected in the field for detection.
- Time span: Choose a time span from the drop-down menu. Your data is downsampled such that it will have one point for each chunk of time selected. For example, if you chose 5s, you will have one point for each 5-second period..
- Select Aggregate Data when ready.
- Click Detect Anomalies.
- Optionally adjust the Detection sensitivity. By default, sensitivity is set to Medium. Changing to Low or High automatically runs the query again.
Opting for High sensitivity usually results in more anomalies being detected, depending on the characteristics of the time series. It's possible that both Medium and High sensitivity yield the same number of anomalies. In these cases a message displays to confirm that the same number of anomalies were found using both sensitivity options for your time series.
- The Anomaly Data panel is populated with your data plotted, and any anomalies marked with yellow dots. The app finds anomalous points as well as periods of anomalous behavior. You can also view the anomalies listed in a table.
The legend displays the number of anomalies detected. If there is a period of anomalous behavior (consecutive points all marked as anomalies), that period is counted as 1 anomaly. Meaning the number in the legend might not match the number of rows in the table.
- If you are pleased with the anomaly detection job results, click Save Job.
- When using the app, Splunk Search Processing Language (SPL) is generated for you. Choose View SPL to view and copy the SPL for use elsewhere in the Splunk platform.
- You can also choose Open in Search to open a new Splunk search using this SPL query. You can modify the SPL as needed, prior to running the new search.
- Navigate back to the Job Dashboard to see the new job listed. From this view you can operationalize your results, detect anomalies on a schedule that makes sense for the time series you are monitoring, and create alerts based on selected triggers or missing data.


Manage and operationalize jobs
After you create an anomaly detection job, you can manage and operationalize that job on the Job Dashboard. The following image shows the dashboard with an example job populating the dashboard fields.

The dashboard displays the following job-related information and actionable options:
| Dashboard field | Field details |
|---|---|
| Name | The job name entered on the create job page.
Drill down to view additional job details including the detection sensitivity, job schedule, and the alert actions and chosen trigger conditions for both anomalies and missing data. |
| Description | The job description entered on the create job page, if any. |
| Schedule | View the current scheduling parameters for the job.
Click Edit to choose or change the frequency and time for the job to run. You must first schedule a job in order to create job-related alerts. Users require the |
| Alert Trigger Condition | View the current alerting parameters for the job.
Click Edit to choose or change which trigger conditions generate an alert. Decide where to deliver the alert and with what subject line. You can also be alerted on missing data, when a chosen number of consecutive data point values are missing. |
| Status | Toggle the job as On or Off. |
| Actions | Use this menu to view the job's SPL, open the job in a new Search tab, or delete the job. |
| Install or upgrade the Splunk App for Anomaly Detection | Splunk App for Anomaly Detection version dependencies |
This documentation applies to the following versions of Splunk® App for Anomaly Detection: 1.1.0, 1.1.1, 1.1.2
Feedback submitted, thanks!