Install and configure the Content Pack for Splunk Infrastructure Monitoring
Perform the following high-level steps to configure the Content Pack for Splunk Infrastructure Monitoring:
- Install the Content Pack for Splunk Infrastructure Monitoring
- Enable the entity discovery searches
- Configure modular inputs
- Review and tune KPI base searches
- Review and tune KPI thresholds
Prerequisites
You have to meet the following prerequisites to install and configure the Content Pack for Splunk Infrastructure Monitoring:
| Prerequisite | Description |
|---|---|
| Back up your environment | Create a full backup of your ITSI environment in case you need to uninstall the content pack later. For more information, see Create a full backup in the Administration Manual. |
| Configure the Splunk Infrastructure Monitoring Add-on | The Splunk Infrastructure Monitoring Add-on lets you collect metrics and event data from Splunk Infrastructure Monitoring. For configuration instructions, see Configure the Splunk Infrastructure Monitoring Add-on. |
Step 1: Install the content pack
The Content Pack for Splunk Infrastructure Monitoring is automatically available for installation once you have installed the Splunk App for Content Packs on the search head with ITSI 4.9.0 or higher or IT Essentials Work 4.9.0 or higher. For steps to install the Splunk App for Content Packs, go to the installation instructions for the Splunk App for Content Packs. After you install the Splunk App for Content Packs, you can follow these steps install the content pack:
- From the ITSI main menu, click Configuration > Data Integrations.
- Click Add structure to your data.
- Select the Splunk Infrastructure Monitoring content pack.
- Review what's included in the content pack and then click Proceed.
- Configure the settings:
- Choose which objects to install: For a first-time installation, select the items you want to install and deselect any you're not interested in. For an upgrade, the installer identifies which objects from the content pack are new and which ones already exist in your environment from a previous installation. You can selectively choose which objects to install from the new version or install all objects.
- Choose a conflict resolution rule for the objects you install: For upgrades or subsequent installs, decide what happens to duplicate objects introduced from the content pack. Choose from these options:
- Install as new: Any existing identical objects in your environment remain intact.
- Replace existing: Existing identical objects are replaced with those from the new installation. Any changes you previously made to these objects are overwritten.
- Import as enabled: Select whether to install objects as enabled or leave them in their original state. We recommend that you import objects as disabled to ensure your environment doesn't break from the addition of new content. This setting only applies to services, correlation searches, and aggregation policies. All other objects such as KPI base searches and saved searches are installed in their original state regardless of the option you choose.
- Add a prefix to your new objects: Optionally, append a custom prefix to each object installed from the content pack. For example, you might prefix your objects with
CP-to indicate they came from a content pack. This option can help you locate and manage the objects after installation. - Backfill service KPIs: Optionally backfill your ITSI environment with the previous seven days of KPI data. Consider enabling backfill if you want to configure adaptive thresholding and predictive analytics for the new services. This setting only applies to KPIs, not service health scores.
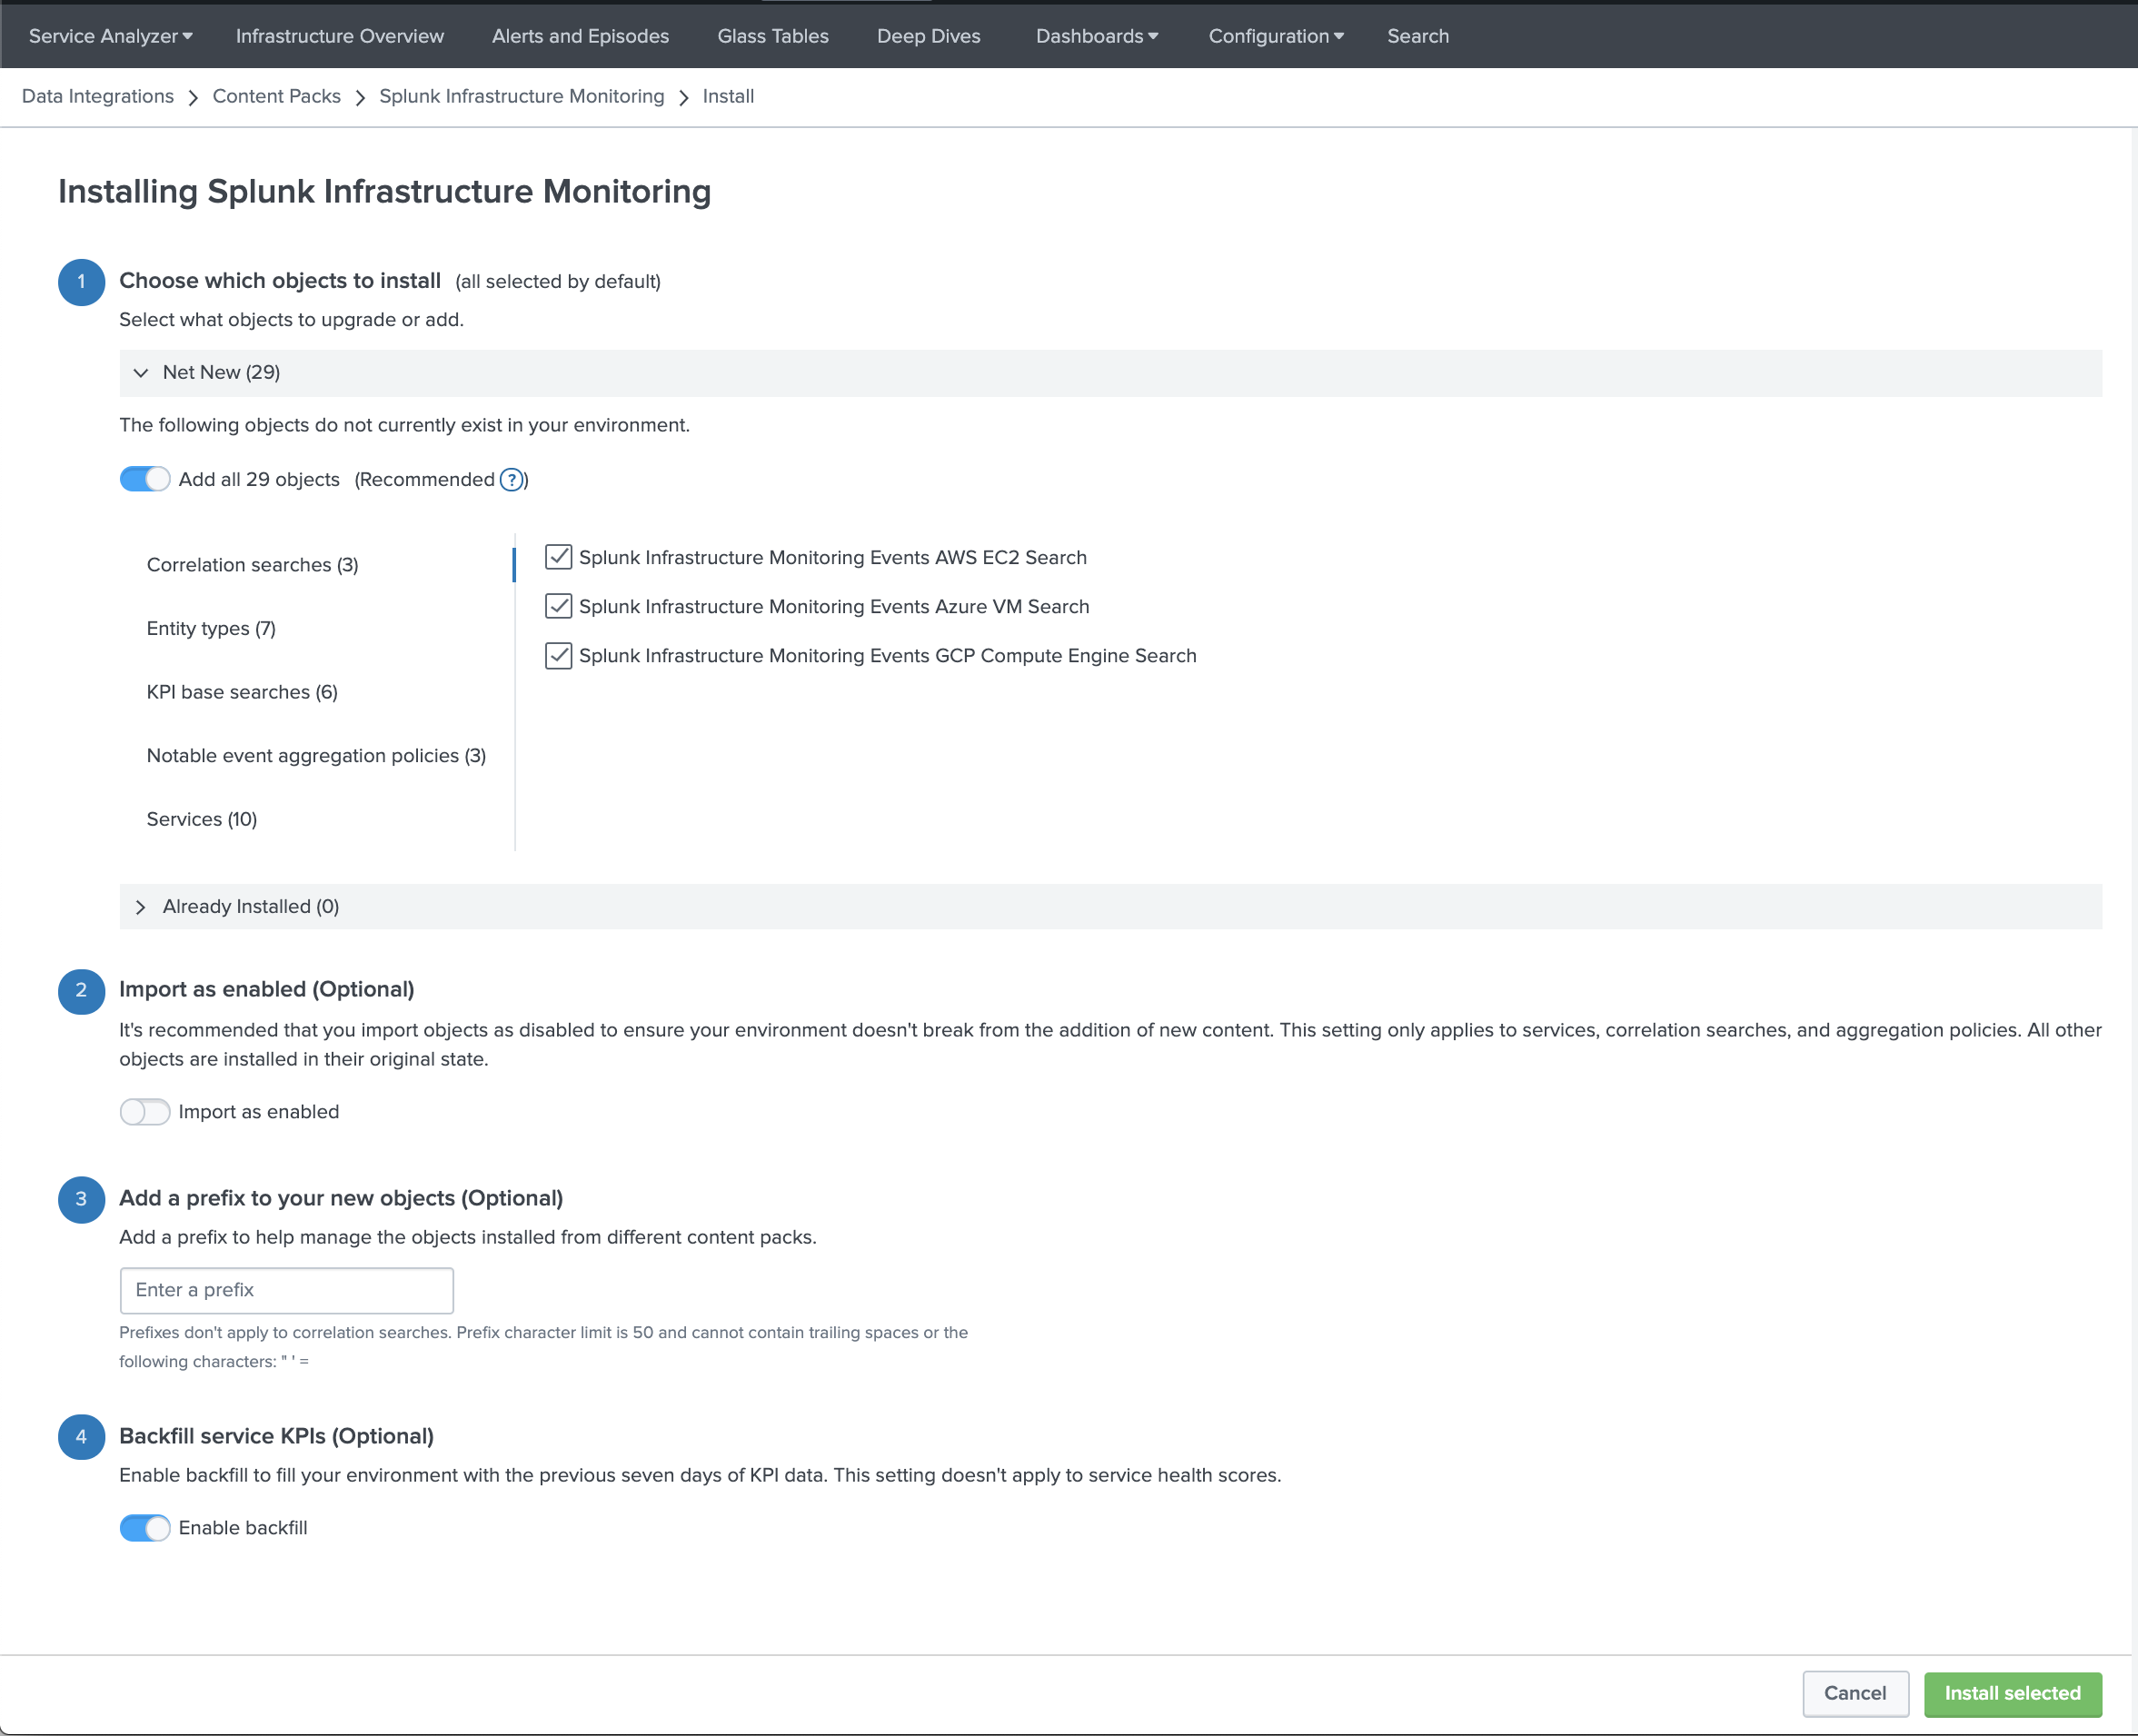
- When you've made your selections, click Install selected.
- Click Install to confirm the installation. When the installation completes you can view all objects that were installed in your environment. A green checkmark on the Data Integrations page indicates which content packs you've already installed.

Step 2: Enable the entity discovery searches
There are six entity discovery searches included with this content pack. They are disabled by default. When you ready to get your data in, follow these steps to enable the entity discover searches for Splunk Infrastructure Monitoring.
- In Splunk Enterprise go to Settings > Advanced Search > Search macros.
- In the Type dropdown, select All.
- In the App dropdown, select App: Splunk Infrastructure Monitoring (DA-ITSI-CP-splunk-infra-monitoring).
- In the Owner dropdown, select All.
- Depending on the searches you selected to install, these entity discovery searches are available to enable:
IT Service Intelligence - SIM AWS EC2 entitiesIT Service Intelligence - SIM AWS Lambda entitiesIT Service Intelligence - SIM Azure Functions entitiesIT Service Intelligence - SIM Azure VM entitiesIT Service Intelligence - SIM Google Cloud Functions entitiesIT Service Intelligence - SIM Google Compute Engine entities
- Select Edit > Enable for each search you want to enable.
Step 3: Configure modular inputs
The Splunk Infrastructure Monitoring Add-on contains a modular input called Splunk Infrastructure Monitoring SignalFlow Stream that uses SignalFlow computations to stream metrics from Infrastructure Monitoring into Splunk using a long-standing modular input job. You need to add the following programs to the modular input to significantly improve the performance of the searches included in this content pack. For instructions to add and configure modular inputs for this add-on, see Configure inputs in the Splunk Infrastructure Monitoring Add-on.
To add the programs to the modular input, perform the following steps:
- Within Splunk, go to Settings > Data Inputs.
- Open the modular input named Splunk Infrastructure Monitoring Data Streams.
- Click New and add each of the following programs separately:
AWS input stream
Continuously pulls a subset of AWS data monitored by Infrastructure Monitoring into the Splunk platform.
"data('CPUUtilization', filter=filter('stat', 'mean') and filter('namespace', 'AWS/EC2') and filter('InstanceId', '*'), rollup='average').publish(); data('NetworkIn', filter=filter('stat', 'sum') and filter('namespace', 'AWS/EC2') and filter('InstanceId', '*'), rollup='sum').publish(); data('NetworkOut', filter=filter('stat', 'sum') and filter('namespace', 'AWS/EC2') and filter('InstanceId', '*'), rollup='sum').publish(); data('NetworkPacketsIn', filter=filter('stat', 'sum') and filter('namespace', 'AWS/EC2') and filter('InstanceId', '*'), rollup='sum').publish(); data('NetworkPacketsOut', filter=filter('stat', 'sum') and filter('namespace', 'AWS/EC2') and filter('InstanceId', '*'), rollup='sum').publish(); data('DiskReadBytes', filter=filter('stat', 'sum') and filter('namespace', 'AWS/EC2') and filter('InstanceId', '*'), rollup='sum').publish(); data('DiskWriteBytes', filter=filter('stat', 'sum') and filter('namespace', 'AWS/EC2') and filter('InstanceId', '*'), rollup='sum').publish(); data('DiskReadOps', filter=filter('stat', 'sum') and filter('namespace', 'AWS/EC2') and filter('InstanceId', '*'), rollup='sum').publish(); data('DiskWriteOps', filter=filter('stat', 'sum') and filter('namespace', 'AWS/EC2') and filter('InstanceId', '*'), rollup='sum').publish(); data('StatusCheckFailed', filter=filter('stat', 'count') and filter('namespace', 'AWS/EC2') and filter('InstanceId', '*'), rollup='sum').publish(); " | "data('Duration', filter=filter('stat', 'sum') and filter('namespace', 'AWS/Lambda') and filter('Resource', '*'), rollup='sum').publish(); data('Errors', filter=filter('stat', 'sum') and filter('namespace', 'AWS/Lambda') and filter('Resource', '*'), rollup='sum').publish(); data('ConcurrentExecutions', filter=filter('stat', 'sum') and filter('namespace', 'AWS/Lambda') and filter('Resource', '*'), rollup='sum').publish(); data('Invocations', filter=filter('stat', 'sum') and filter('namespace', 'AWS/Lambda') and filter('Resource', '*'), rollup='sum').publish(); data('Throttles', filter=filter('stat', 'sum') and filter('namespace', 'AWS/Lambda') and filter('Resource', '*'), rollup='sum').publish(); " | "data('CPUUtilization', filter=filter('stat', 'mean') and filter('namespace', 'AWS/RDS'), rollup='average').publish(); data('DBLoad', filter=filter('stat', 'mean') and filter('namespace', 'AWS/RDS'), rollup='average').publish(); data('DatabaseConnections', filter=filter('stat', 'count') and filter('namespace', 'AWS/RDS'), rollup='latest').publish(); data('FreeStorageSpace', filter=filter('stat', 'mean') and filter('namespace', 'AWS/RDS'), rollup='latest').publish(); data('TransactionLogsDiskUsage', filter=filter('stat', 'mean') and filter('namespace', 'AWS/RDS'), rollup='latest').publish(); data('NetworkReceiveThroughput', filter=filter('stat', 'mean') and filter('namespace', 'AWS/RDS'), rollup='average').publish(); data('ReadIOPS', filter=filter('stat', 'mean') and filter('namespace', 'AWS/RDS'), rollup='average').publish(); data('ReadLatency', filter=filter('stat', 'mean') and filter('namespace', 'AWS/RDS'), rollup='average').publish(); data('ReadThroughput', filter=filter('stat', 'mean') and filter('namespace', 'AWS/RDS'), rollup='average').publish(); data('WriteIOPS', filter=filter('stat', 'mean') and filter('namespace', 'AWS/RDS'), rollup='average').publish(); data('WriteLatency', filter=filter('stat', 'mean') and filter('namespace', 'AWS/RDS'), rollup='average').publish();"Azure input stream
Continuously pulls a subset of Azure data monitored by Infrastructure Monitoring into the Splunk platform.
"data('Percentage CPU', filter=filter('primary_aggregation_type', 'true') and filter('aggregation_type', 'average'), rollup='average').promote('azure_resource_name').publish(); data('Network In', filter=filter('primary_aggregation_type', 'true') and filter('aggregation_type', 'total'), rollup='sum' ).promote('azure_resource_name').publish(); data('Network Out', filter=filter('primary_aggregation_type', 'true') and filter('aggregation_type', 'total'), rollup='sum').promote('azure_resource_name').publish(); data('Inbound Flows', filter=filter('primary_aggregation_type', 'true') and filter('aggregation_type', 'average'), rollup='average').promote('azure_resource_name').publish(); data('Outbound Flows', filter=filter('primary_aggregation_type', 'true') and filter('aggregation_type', 'average'), rollup='average').promote('azure_resource_name').publish(); data('Disk Write Operations/Sec', filter=filter('primary_aggregation_type', 'true') and filter('aggregation_type', 'average'), rollup='average').promote('azure_resource_name').publish(); data('Disk Read Operations/Sec', filter=filter('primary_aggregation_type', 'true') and filter('aggregation_type', 'average'), rollup='average').promote('azure_resource_name').publish(); data('Disk Read Bytes', filter=filter('primary_aggregation_type', 'true') and filter('aggregation_type', 'total'), rollup='sum' ).promote('azure_resource_name').publish(); data('Disk Write Bytes', filter=filter('primary_aggregation_type', 'true') and filter('aggregation_type', 'total'), rollup='sum').promote('azure_resource_name').publish();" | "data('FunctionExecutionCount', filter=filter('primary_aggregation_type', 'true') and filter('aggregation_type', 'total') and filter('is_Azure_Function', 'true'), rollup='sum').publish(); data('Requests', filter=filter('primary_aggregation_type', 'true') and filter('aggregation_type', 'total') and filter('is_Azure_Function', 'true'), rollup='sum').publish(); data('FunctionExecutionUnits', filter=filter('primary_aggregation_type', 'true') and filter('aggregation_type', 'total') and filter('is_Azure_Function', 'true'), rollup='sum').publish(); data('AverageMemoryWorkingSet', filter=filter('primary_aggregation_type', 'true') and filter('aggregation_type', 'average') and filter('is_Azure_Function', 'true'), rollup='Average').publish(); data('AverageResponseTime', filter=filter('primary_aggregation_type', 'true') and filter('aggregation_type', 'average') and filter('is_Azure_Function', 'true'), rollup='Average').publish(); data('BytesSent', filter=filter('primary_aggregation_type', 'true') and filter('aggregation_type', 'total') and filter('is_Azure_Function', 'true'), rollup='sum').publish(); data('BytesReceived', filter=filter('primary_aggregation_type', 'true') and filter('aggregation_type', 'total') and filter('is_Azure_Function', 'true'), rollup='sum').publish(); data('CpuTime', filter=filter('primary_aggregation_type', 'true') and filter('aggregation_type', 'total') and filter('is_Azure_Function', 'true'), rollup='sum').publish(); data('Http5xx', filter=filter('primary_aggregation_type', 'true') and filter('aggregation_type', 'total') and filter('is_Azure_Function', 'true'), rollup='sum').publish();"GCP input stream
Continuously pulls a subset of Google Cloud Platform (GCP) data monitored by Infrastructure Monitoring into the Splunk platform.
"data('instance/cpu/utilization', filter=filter('instance_id', '*'), rollup='average').publish(); data('instance/network/sent_packets_count', filter=filter('instance_id', '*'), rollup='sum').publish(); data('instance/network/received_packets_count', filter=filter('instance_id', '*'), rollup='sum').publish(); data('instance/network/received_bytes_count', filter=filter('instance_id', '*'), rollup='sum').publish(); data('instance/network/sent_bytes_count', filter=filter('instance_id', '*'), rollup='sum').publish(); data('instance/disk/write_bytes_count', filter=filter('instance_id', '*'), rollup='sum').publish(); data('instance/disk/write_ops_count', filter=filter('instance_id', '*'), rollup='sum').publish(); data('instance/disk/read_bytes_count', filter=filter('instance_id', '*'), rollup='sum').publish(); data('instance/disk/read_ops_count', filter=filter('instance_id', '*'), rollup='sum').publish();" | "data('function/execution_times', rollup='average').scale(0.000001).publish(); data('function/user_memory_bytes', rollup='average').publish(); data('function/execution_count', rollup='sum').publish(); data('function/active_instances', rollup='latest').publish(); data('function/network_egress', rollup='sum').publish();"
Don't modify the index field under More settings. This index has to be sim_metrics for the content pack searches to function.
For more information about modular inputs, see Modular inputs overview in the Developing Views and Apps for Splunk Web manual.
The add-on also includes a troubleshooting dashboard called Splunk Infrastructure Monitoring Modular Input Health Check that provides information about the metric time series (MTS) being collected as well as instance and computation-level statistics. For more information, see Troubleshoot the Splunk Infrastructure Monitoring modular input in the Splunk Infrastructure Monitoring Add-on manual.
Step 4: Review and tune the KPI base searches
Within ITSI, go to Configuration > KPI Base Searches. Review and tune each of the following base searches to run at a frequency matching your data collection interval:
SIM:Cloud.AWS_EC2SIM:Cloud.AWS_Lambda_CloudwatchSIM:Cloud.AWS_Lambda_WrapperSIM:Cloud.Azure_FunctionsSIM:Cloud.Azure_VMSIM:Cloud.GCP_ComputeSIM:Cloud.GCP_Functions.StackdriverSIM:Cloud.GCP_Functions.Wrapper
For more information about KPI base searches, see Create KPI base searches in ITSI in the ITSI Service Insights manual.
Step 5: Review and tune the KPI thresholds
The KPIs in each service template are tied to the Infrastructure Monitoring KPI base searches and have thresholds representing best practices. Tune these threshold values according to your environment. Use the corresponding linked services to validate your thresholds. For more information, see Configure KPI thresholds in ITSI in the Service Insights manual.
Next step
After you install and configure the Content Pack for Splunk Infrastructure Monitoring, you can start actively monitoring your environment using Event Analytics in ITSI. For more information, see Use the Content Pack for Splunk Infrastructure Monitoring.
| Release notes for the Content Pack for Splunk Infrastructure Monitoring | Use the Content Pack for Splunk Infrastructure Monitoring |
This documentation applies to the following versions of Content Pack for Splunk Infrastructure Monitoring: 1.0.0
Feedback submitted, thanks!