Use the Content Pack for Splunk Infrastructure Monitoring
After you install and configure the Content Pack for Splunk Infrastructure Monitoring, it's time to start actively monitoring your environment. The content pack includes three preconfigured correlation searches that pull Splunk Infrastructure Monitoring event data, including anomalous events and clear events, from each of your integrated AWS, Azure, and GCP instances. The correlation searches create corresponding notable events in ITSI with drilldown links back to the event in Infrastructure Monitoring. The content pack also includes three aggregation policies that group these events into meaningful episodes.
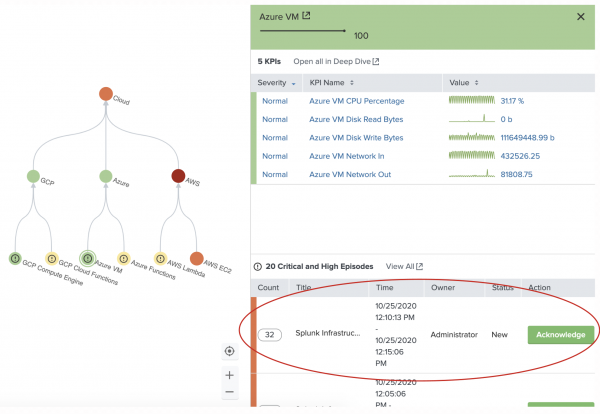
The following image shows an Azure service in the Service Analyzer and its corresponding episode:
Infrastructure Monitoring records an event when monitoring data meets an anomalous condition defined in a detector. When the detector's trigger condition is no longer true, it records a clear event. For more information, see About Detectors and Alerts in the Splunk Infrastructure Monitoring documentation.
Tune correlation searches
The correlation searches in the content pack use the event subcommand from the Splunk Infrastructure Monitoring Add-on to identify any detectors that have fired for a given cloud provider. For example, if a detector creates an event when you exceed a limit on unreserved instances of AWS, the AWS correlation search creates a corresponding notable event in ITSI.
The following correlation searches are included in the content pack.
Splunk Infrastructure Monitoring Events AWS EC2 SearchSplunk Infrastructure Monitoring Events Azure VM SearchSplunk Infrastructure Monitoring Events GCP Compute Engine Search
Each search is enabled by default. To view, modify, or disable them, go to Configuration > Correlation Searches from the ITSI main menu.
Each correlation search executes the sim command to get all events within your monitored AWS EC2, Azure VM, or GCP environment. The searches extract the event ID and detector ID from the data, and the eval function gets the instance_id, which is one of the entity aliases in ITSI. The join function assigns the alias field to a value. Each search runs every minute with a 15-minute lookback time. You can tune these parameters to run at a frequency matching your Infrastructure Monitoring data collection interval.
For more information about correlation searches, see Overview of correlation searches in ITSI in the Event Analytics manual.
event subcommand
Each correlation search includes the event subcommand from the Splunk Infrastructure Monitoring Add-on, which uses the GET /v2/event API to retrieve events. This endpoint returns events generated by Infrastructure Monitoring, which have a name prefixed by sf_ to indicate that they originated from Infrastructure Monitoring.
For usage examples of the event command, see event query syntax in the Splunk Infrastructure Monitoring Add-on manual.
Tune aggregation policies
This content pack includes the following notable event aggregation policies that group notable events from Infrastructure Monitoring into episodes:
SIM AWS EC2 AlertsSIM Azure VM AlertsSIM GCP Compute Engine Alerts
The aggregation policies are enabled by default. To view, modify, or disable them, go to Configuration > Notable Event Aggregation Policies from the ITSI main menu.
The aggregation policies group events into episodes based on whether they came from AWS, Azure, or GCP. You can modify the filtering and breaking criteria to meet your specific use cases. For instructions, see Configure episode filtering and breaking criteria in ITSI.
Each policy also contains action rules that change the severity to High if the episode has more than 30 events, and to Critical if is has more than 90 events. You can modify the existing action rules or build additional rules, such as adding a comment, sending an email, or creating a ticket in an external system. For more information about creating action rules, see Configure episode action rules in ITSI in the Event Analytics manual.
View and manage Infrastructure Monitoring events in ITSI
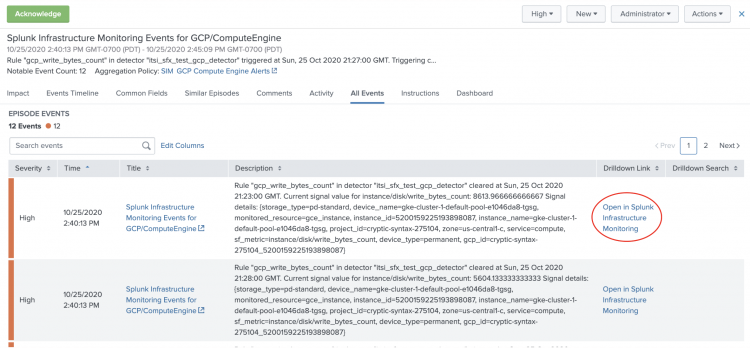
All notable events generated by a Infrastructure Monitoring correlation search have a title with the format Splunk Infrastructure Monitoring Events for <entity_type>. For example, Splunk Infrastructure Monitoring Events for AWS EC2. They each have a severity of High and a status of New. Each notable event includes a drilldown link back to the detector that created the event in Infrastructure Monitoring. The description field of the ITSI notable event is the informational field in the Infrastructure Monitoring event. You can modify this description using the Notable Event Description field of the correlation search.
For more information about Episode Review and episode management, see Overview of Episode Review in ITSI.
The following image shows events in Episode Review generated from the GCP Compute Engine correlation search. Each event includes a drilldown link back to the event in Infrastructure Monitoring:
Bidirectional integration with Infrastructure Monitoring
ITSI includes a bidirectional integration with Infrastructure Monitoring that lets you clear all Infrastructure Monitoring incidents within an episode. An Infrastructure Monitoring incident is the combination of a trigger event and a clear event.
To clear all incidents within an ITSI episode, select the episode in Episode Review and click Actions > Clear Splunk Infrastructure Monitoring Incidents. If the detector's alert condition is still active after clearing, Infrastructure Monitoring creates a new incident for the alert.
The option to clear Infrastructure Monitoring incidents only appears after you install and configure the Splunk Infrastructure Monitoring Add-on.
Monitor AWS, Azure, and GCP entities in the Infrastructure Overview
Each Infrastructure Monitoring entity type contains a set of vital metrics, which are statistical calculations based on SPL searches that represent the overall health of entities of that type. You can view each entity type in the Infrastructure Overview and drill down further into each of their vital metrics. For more information about the Infrastructure Overview and vital metrics, see About the Infrastructure Overview in ITSI.
The following table lists the default vital metrics for each Infrastructure Monitoring entity type:
| Entity type | Vital metrics |
|---|---|
| AWS EC2 |
|
| AWS Lambda |
|
| Azure Virtual Machines |
|
| Azure Functions |
|
| GCP Compute Engine |
|
| GCP Cloud Functions |
|
| Install and configure the Content Pack for Splunk Infrastructure Monitoring |
This documentation applies to the following versions of Content Pack for Splunk Infrastructure Monitoring: 1.0.0


 Download manual
Feedback submitted, thanks!