Use the Content Pack for Microsoft 365
Once you install the Content Pack for Microsoft 365 and configure the Splunk Add-on for Microsoft Office 365 to collect data, you can use the content pack to monitor your Microsoft 365 environment.
The content pack includes the following views into the different layers of your Microsoft 365 services:
- Glass Tables: Visualize and monitor the interrelationships and dependencies across your services.
- Service Analyzer: Provides real-time visibility into the health of your service components.
- Entity Health page: Group and analyze entities receiving data from Microsoft 365.
Monitor your overall Microsoft 365 environment
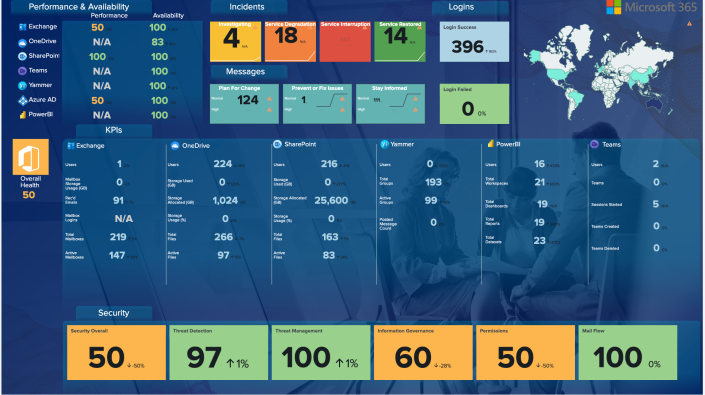
The content pack includes several preconfigured Glass Tables that give you a real-time overview of what's going on in your Microsoft 365 environment.
The following image shows the M365 Overview Dashboard:
Microsoft 365 Glass Tables
The following Glass Tables are included in the content pack:
You must install the Splunk Add-on for Microsoft Exchange for the Exchange and 365 Glass Table to display Microsoft Exchange data. See Install and configure the Content Pack for Microsoft Exchange.
| Glass Table | Description |
|---|---|
| Exchange & 365 Glass Table [Executive Overview] | This combined executive overview contains executive-level metrics for Microsoft 365 and Microsoft Exchange. This view enables your IT operations team to drill down into the individual services in each area. Click any abnormal service health score to open and investigate it in the Service Analyzer. |
| M365 Executive Overview |
This executive overview contains executive-level metrics to illustrate the service levels you're delivering. This view displays the availability and performance of major areas of Microsoft 365, including OneDrive, Sharepoint, Teams, Yammer, and Exchange. This view enables your IT Operations team to drill down into the individual services in each area. Click any abnormal service health score to open and investigate it in the Service Analyzer. |
| M365 Incident and Message Dashboard | The Incident and Message view provides visibility across your services and displays trends for each incident, enabling you to proactively communicate about activities and events that impact customer experience. The glass table also displays the most recent incidents affecting your services, and recent messages. |
| M365 Overview Dashboard | This view provides visibility of top-level service health as well as base metrics for the top services in Microsoft 365 such as Exchange, OneDrive, SharePoint, Yammer, PowerBI, and Teams, enabling you to remediate outages or investigate low service health scores. You can also view security metrics and login success and failure trends in a single view. |
| M365 Security Dashboard - Overview | The security view highlights metrics that track suspicious activities, unusual emails, and login anomalies to help you detect security threats to your environment. You can drill down into specific security anomalies using the Service Analyzer. |
| M365 Security Dashboard - Threat Detection | The threat detection view provides a high-level view into potential security threats to your environment, such as authorization/login anomalies, suspicious user activities, and malware detection. You can drill down into specific security anomalies using the Service Analyzer. |
| M365 Security Dashboard - Threat Management | Track and manage suspicious activities, such as emails reported as phishing attempts or security and compliance issues. You can drill down into specific anomalies using the Service Analyzer. |
Monitor Microsoft 365 services
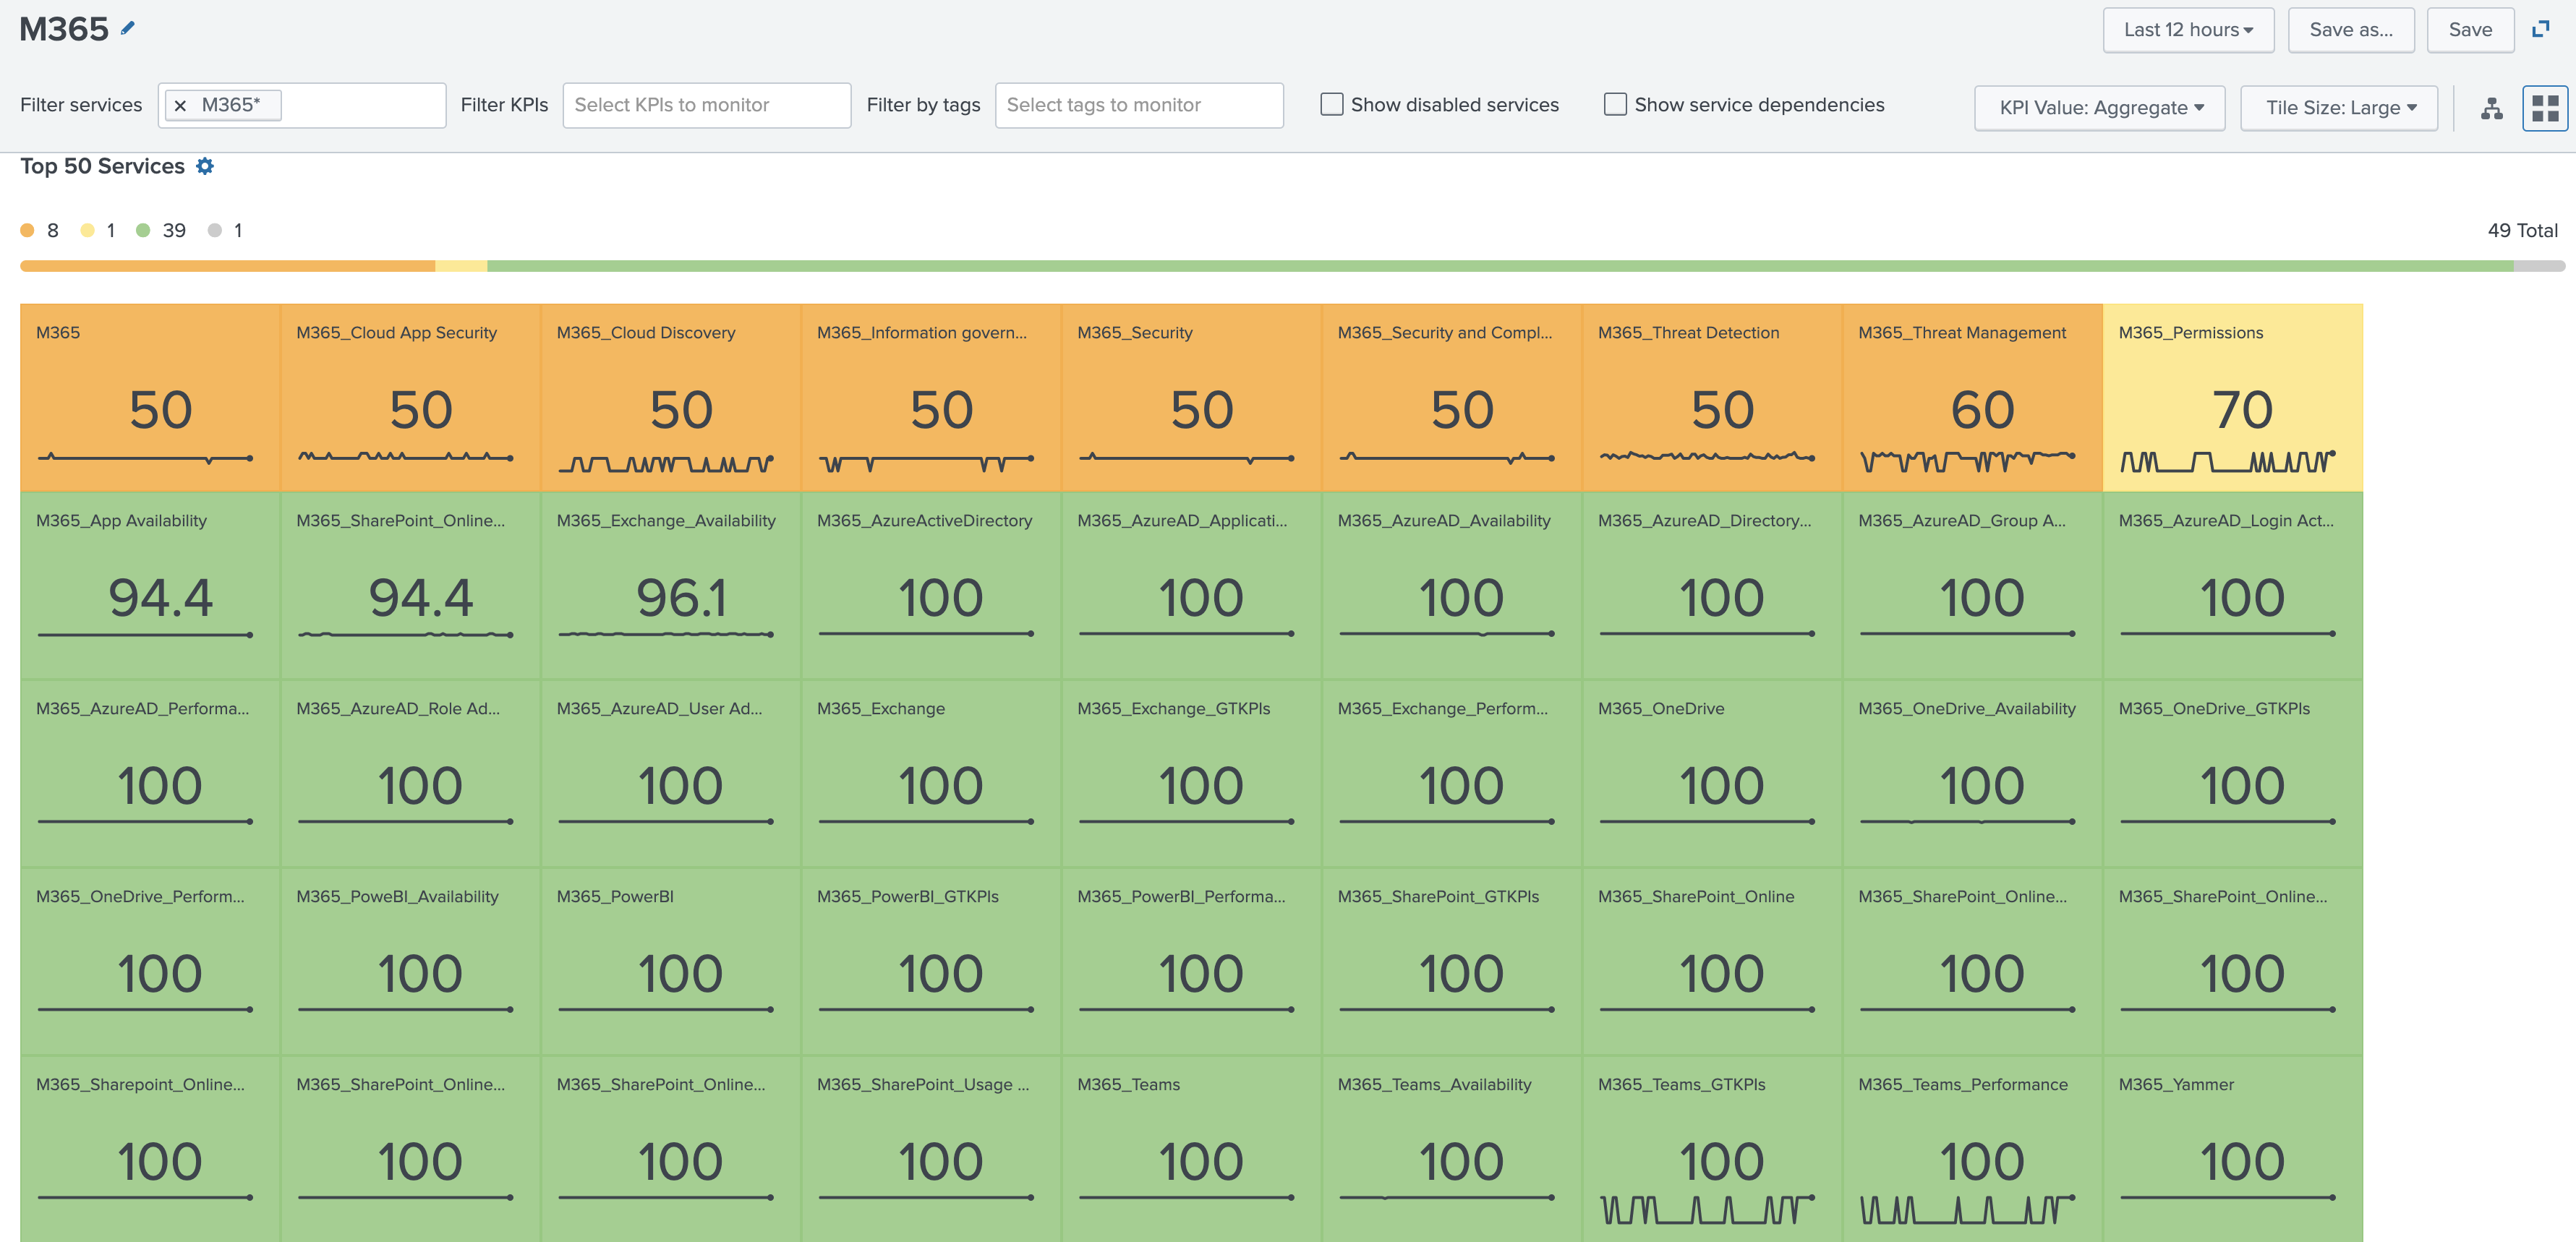
The M365 Service Analyzer provides instant, real-time visibility into the health of your Microsoft 365 environment and all its components, with granular composite health scores across the entire service path. Use the Service Analyzer to quickly detect service anomalies based on visibility into the health of each one of the service components that affect your overall performance including SharePoint, PowerBI, OneDrive, and Exchange.
The M365 Service Analyzer is a premium feature of the content pack and only available for ITSI users.
To access the custom Service Analyzer view, perform the following steps:
- From the ITSI main menu, click Service Analyzer > Analyzers.
- Select M365 Service Analyzer from the list of analyzers.
- Leverage the available fields at filters at the top of the page to curate the content displayed.
Any critical or high severity episodes associated with the service are displayed in the side panel. Click View All to view all associated episodes in Episode Review.
The following image shows the tree view for the Service Analyzer:
Monitor Microsoft 365 alerts
Some services in the Content Pack for Microsoft 365 are configured to generate notable events when aggregate KPI threshold values reach specific levels. The default aggregation policy then groups these events into meaningful episodes in Episode Review.
To monitor and investigate all episodes in your Microsoft 365 environment, navigate to Episode Review. You can drill down into individual episodes to perform more granular root cause analysis, such as viewing an events timeline or examining common fields. You can then take specific actions on these episodes such as pinging a host, sending an email, or creating a ticket in ServiceNow or Remedy.
For more information on using Episode Review, see Overview of Episode Review in ITSI in the Event Analytics Manual.
Monitor Microsoft 365 entities
The content pack includes the following entity types that group entities originating from Microsoft 365:
- ITSI Import Objects - M365 Tenants
- ITSI Import Objects - Power BI Workspaces
- ITSI Import Objects - Sharepoint Sites
The entity types contain a set of vital metrics, which are statistical calculations based on SPL searches that represent the overall health of entities of that type.
To view the Entity Health page for the entity types, perform the following steps:
- From the ITSI or IT Essentials Work main menu, click Infrastructure Overview.
- In the Group by drop-down, choose Entity Type.
- Select one of the Microsoft 365 entity types to drill down into its vital metrics.
For more information about entity types and vital metrics, see Overview of entity types in ITSI in the Entity Integrations Manual.
Vital metrics for M365 Tenants
The following table lists the vital metrics for the M365 Tenants entity type:
| Vital metric | Description |
|---|---|
| Azure Active Users | Displays count of distinct active users in Azure Entra ID (formerly Azure AD), with a span of 10 minutes |
| Exchange Active Users | Displays count of distinct active users in Exchange, with a span of 10 minutes |
| Microsoft Teams Active Users | Displays count of distinct active users in Microsoft Teams, with a span of 10 minutes |
| OneDrive Active Users | Displays count of distinct active users in OneDrive, with a span of 10 minutes |
| Sharepoint Active Users | Displays count of distinct active users in Sharepoint, with a span of 10 minutes |
| Yammer Active Users | Displays count of distinct active users in Yammer, with a span of 10 minutes |
Vital metrics for Power BI Workspaces
The following table lists the vital metrics for the Power BI Workspaces entity type:
| Vital metric | Description |
|---|---|
| Dashboard Views | Displays count of dashboard views in each Power Bi Workspace, with a span of 10 minutes |
| Report Views | Displays count of report views in each Power Bi Workspace, with a span of 10 minutes |
| Report Creations | Displays count of report creations in each Power Bi Workspace, with a span of 10 minutes |
| Dataset Creations | Displays count of dataset creations in each Power Bi Workspace, with a span of 10 minutes |
The following table lists the vital metrics for the Sharepoint Sites entity type:
| Vital metric | Description |
|---|---|
| Page Views Count | Displays page view count in each Sharepoint site, with a span of 10 minutes |
| Distinct User Page View Count | Displays count of distinct users that viewed a page in each Sharepoint site, with a span of 10 minutes |
| File Accessed Count | Displays count of files accessed in each Sharepoint site, with a span of 10 minutes |
| Distinct User File Accessed Count | Displays count of distinct users that accessed a file in each Sharepoint site, with a span of 10 minutes |
Entity dashboards
You can select an individual entity on the Entity Health page to drill down further into its performance metrics and log events. The Event Data Search dashboard displays the most recent log events associated with an entity over the last hour. The Analytics dashboard lets you view the trend of data coming in from each host by source type in a single snapshot.
To learn more about the available entity dashboards, see the following resources:
- To use the Event Data Search, see the Event Data Search dashboard in ITSI.
- To use the Analytics dashboard, see Analyze entity performance metrics in ITSI.
Microsoft 365 dashboards
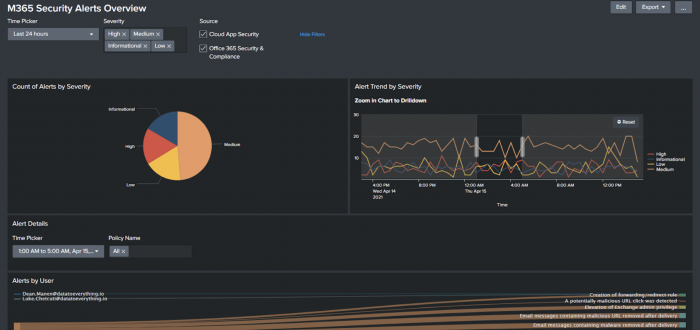
The Content Pack for Microsoft 365 includess several dashboards. These dashboards cover a variety of use cases and enable you to view activity across all of your services.
The following image shows the M365 Security Alerts Overview dashboard:

Available dashboards
The content pack ships with the following dashboards:
- M365 Azure Active Directory Overview
- M365 Usage & Adoption
- M365 Overview
- M365 User Audit
- M365 Exchange Overview
- M365 OneDrive Overview
- M365 OneDrive File Investigator
- M365 Teams Overview
- M365 Teams Activity Audit
- M365 Teams Security Monitoring
- M365 PowerBI Overview
- M365 Sharepoint Overview
- M365 Security Alerts Overview
Access the dashboards
Perform the following steps to access the dashboards:
- Log into Splunk Web.
- Select App > IT Service Intelligence or IT Essentials Work.
- From the navigation bar, select Dashboards > Dashboards to see the list of dashboards.
- In the App column, dashboards listed as DA-ITSI-CP-m365 are part of the Content Pack for Microsoft 365.
| Install and configure the Content Pack for Microsoft 365 | KPI reference for the Content Pack for Microsoft 365 |
This documentation applies to the following versions of Content Pack for Microsoft 365: 1.2.0


 Download manual
Feedback submitted, thanks!