Use the Content Pack for Splunk Observability Cloud
After you install and configure the content pack, you can immediately start monitoring your applications' performance. The content pack contains several useful views and dashboards that provide visibility into the different metrics of your applications.
Monitor Splunk Observability Cloud's overall performance
There are five glass tables that you can use to monitor your Splunk Observability Cloud's performance at a high level. Select Glass Tables from the ITSI menu and select a glass table to view. From the Edit menu you can edit or clone the glass table to customize it to meet your needs.
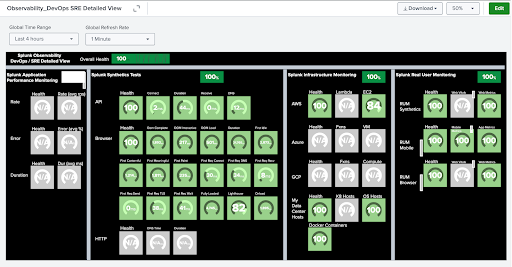
Observability_DevOps SRE Detailed View
The Observability_DevOps SRE Detailed View glass table provides insights across Splunk Synthetic Monitoring, Splunk Application Performance Management, and Splunk Infrastructure Monitoring; at a summary level, as well as two levels down.
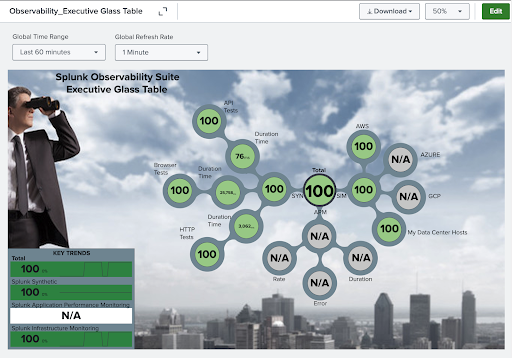
Observability_Executive Glass Table
The Observability_Executive Glass Table delivers rolled-up insights across three major observability areas: Splunk Synthetic Monitoring, Splunk Infrastructure Monitoring, and Splunk Application Performance Monitoring.
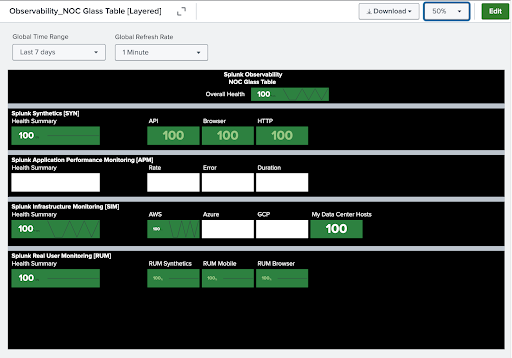
Observability_NOC Glass Table [Layered]
The Observability_NOC Glass Table [Layered] glass table is designed for a 40-foot wall or hallway monitor, enables visibility and awareness, showing the trend and history along with current state for all your critical KPI's rolled up.
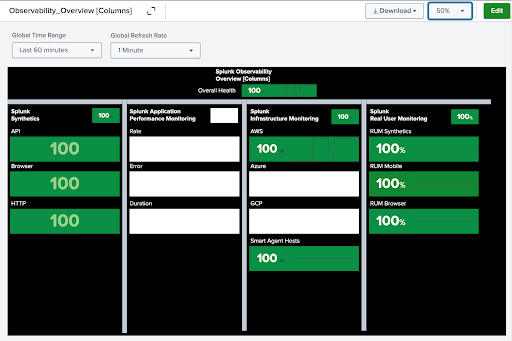
Observability_Overview [Columns]
The Observability_Overview [Columns] glass table provides a quick overview of the three major observability areas: Splunk Synthetic Monitoring, Splunk Application Performance Monitoring, and Splunk Infrastructure Monitoring.
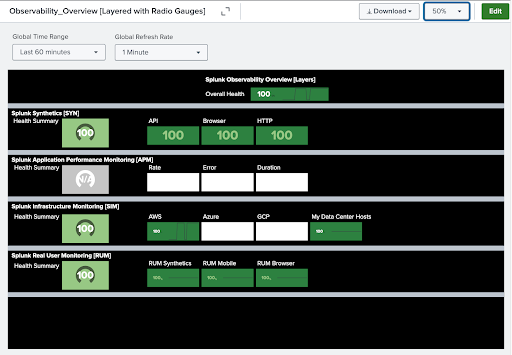
Observability_Overview [Layered with Radio Gauges]
The Observability_Overview [Layered with Radio Gauges] glass table provides immediate insight and results, which can be viewed at a distance, with radio gauges on the left side making it simple to know the status of Splunk Synthetic Monitoring, Splunk Application Performance Monitoring, and Splunk Infrastructure Monitoring for your entire environment.
Monitor your Splunk Observability Cloud services
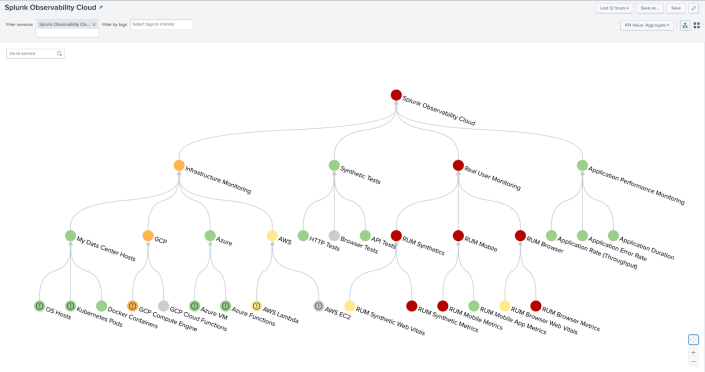
The Splunk Observability Cloud service analyzer included in this content pack provides instant, real-time visibility into the performance of your applications with granular, composite performance metrics across the entire service tree. Detect service anomalies faster with visibility into the performance of each one of the service components that affect your applications' overall performance.
To access the custom Splunk Observability Cloud service analyzer, follow these steps:
- From the ITSI menu, select Service Analyzer > Analyzers.
- Select Splunk Observability Cloud from the list of analyzers.
Monitor your Splunk Observability Cloud entities
The content pack includes the several entity types that group entities originating from Splunk Observability Cloud:
- AWS EC2
- AWS Lambda
- Azure Functions
- Azure VM
- GCP Cloud Functions
- GCP Compute Engine
- OS Hosts
- RUM App Metrics
- RUM Browser Metrics
- RUM Synthetic Metrics
- Splunk Infrastructure Monitoring
- Splunk APM
- Synthetic HTTP Test
- Synthetic API Test
- Synthetic Browser Test
Each entity type contains a set of vital metrics. Vital metrics are statistical calculations based on SPL searches that represent the overall health of entities of that type. To view the Entity Health page for the entity type, follow these steps:
- From the ITSI menu or IT Essentials Work menu, select Infrastructure Overview.
- In the Group by dropdown, choose Entity Type.
- Select the entity type to drill down into its vital metrics.
For more information about entity types and vital metrics, see Overview of entity types in ITSI in the Entity Integrations manual.
Entity dashboards
You can select an individual entity on the Entity Health page to drill down further into its performance metrics and log events. The Event Data Search dashboard displays the most recent log events associated with an entity over the last hour. The Analytics dashboard lets you view the trend of data coming in from each host by source type in a single snapshot.
To learn more about the available entity dashboards, see the following resources:
- To use the Event Data Search, see Event Data Search dashboard in ITSI.
- To use the Analytics dashboard, see Analyze entity performance metrics in ITSI.
Use Splunk Observability Cloud dashboards
The content pack includes 7 dashboards.
- Splunk Observability - RUM App
- Splunk Observability - RUM Browser
- Splunk Observability - RUM Overview
- Splunk Observability - RUM Synthetics
- Splunk Observability - Splunk APM Overview: Provides quick access to rate, error, and duration (RED) metrics from Splunk APM.
- Splunk Observability - SIM Navigation: Dashboard that shows how to navigate from service entities to SIM source of truth.
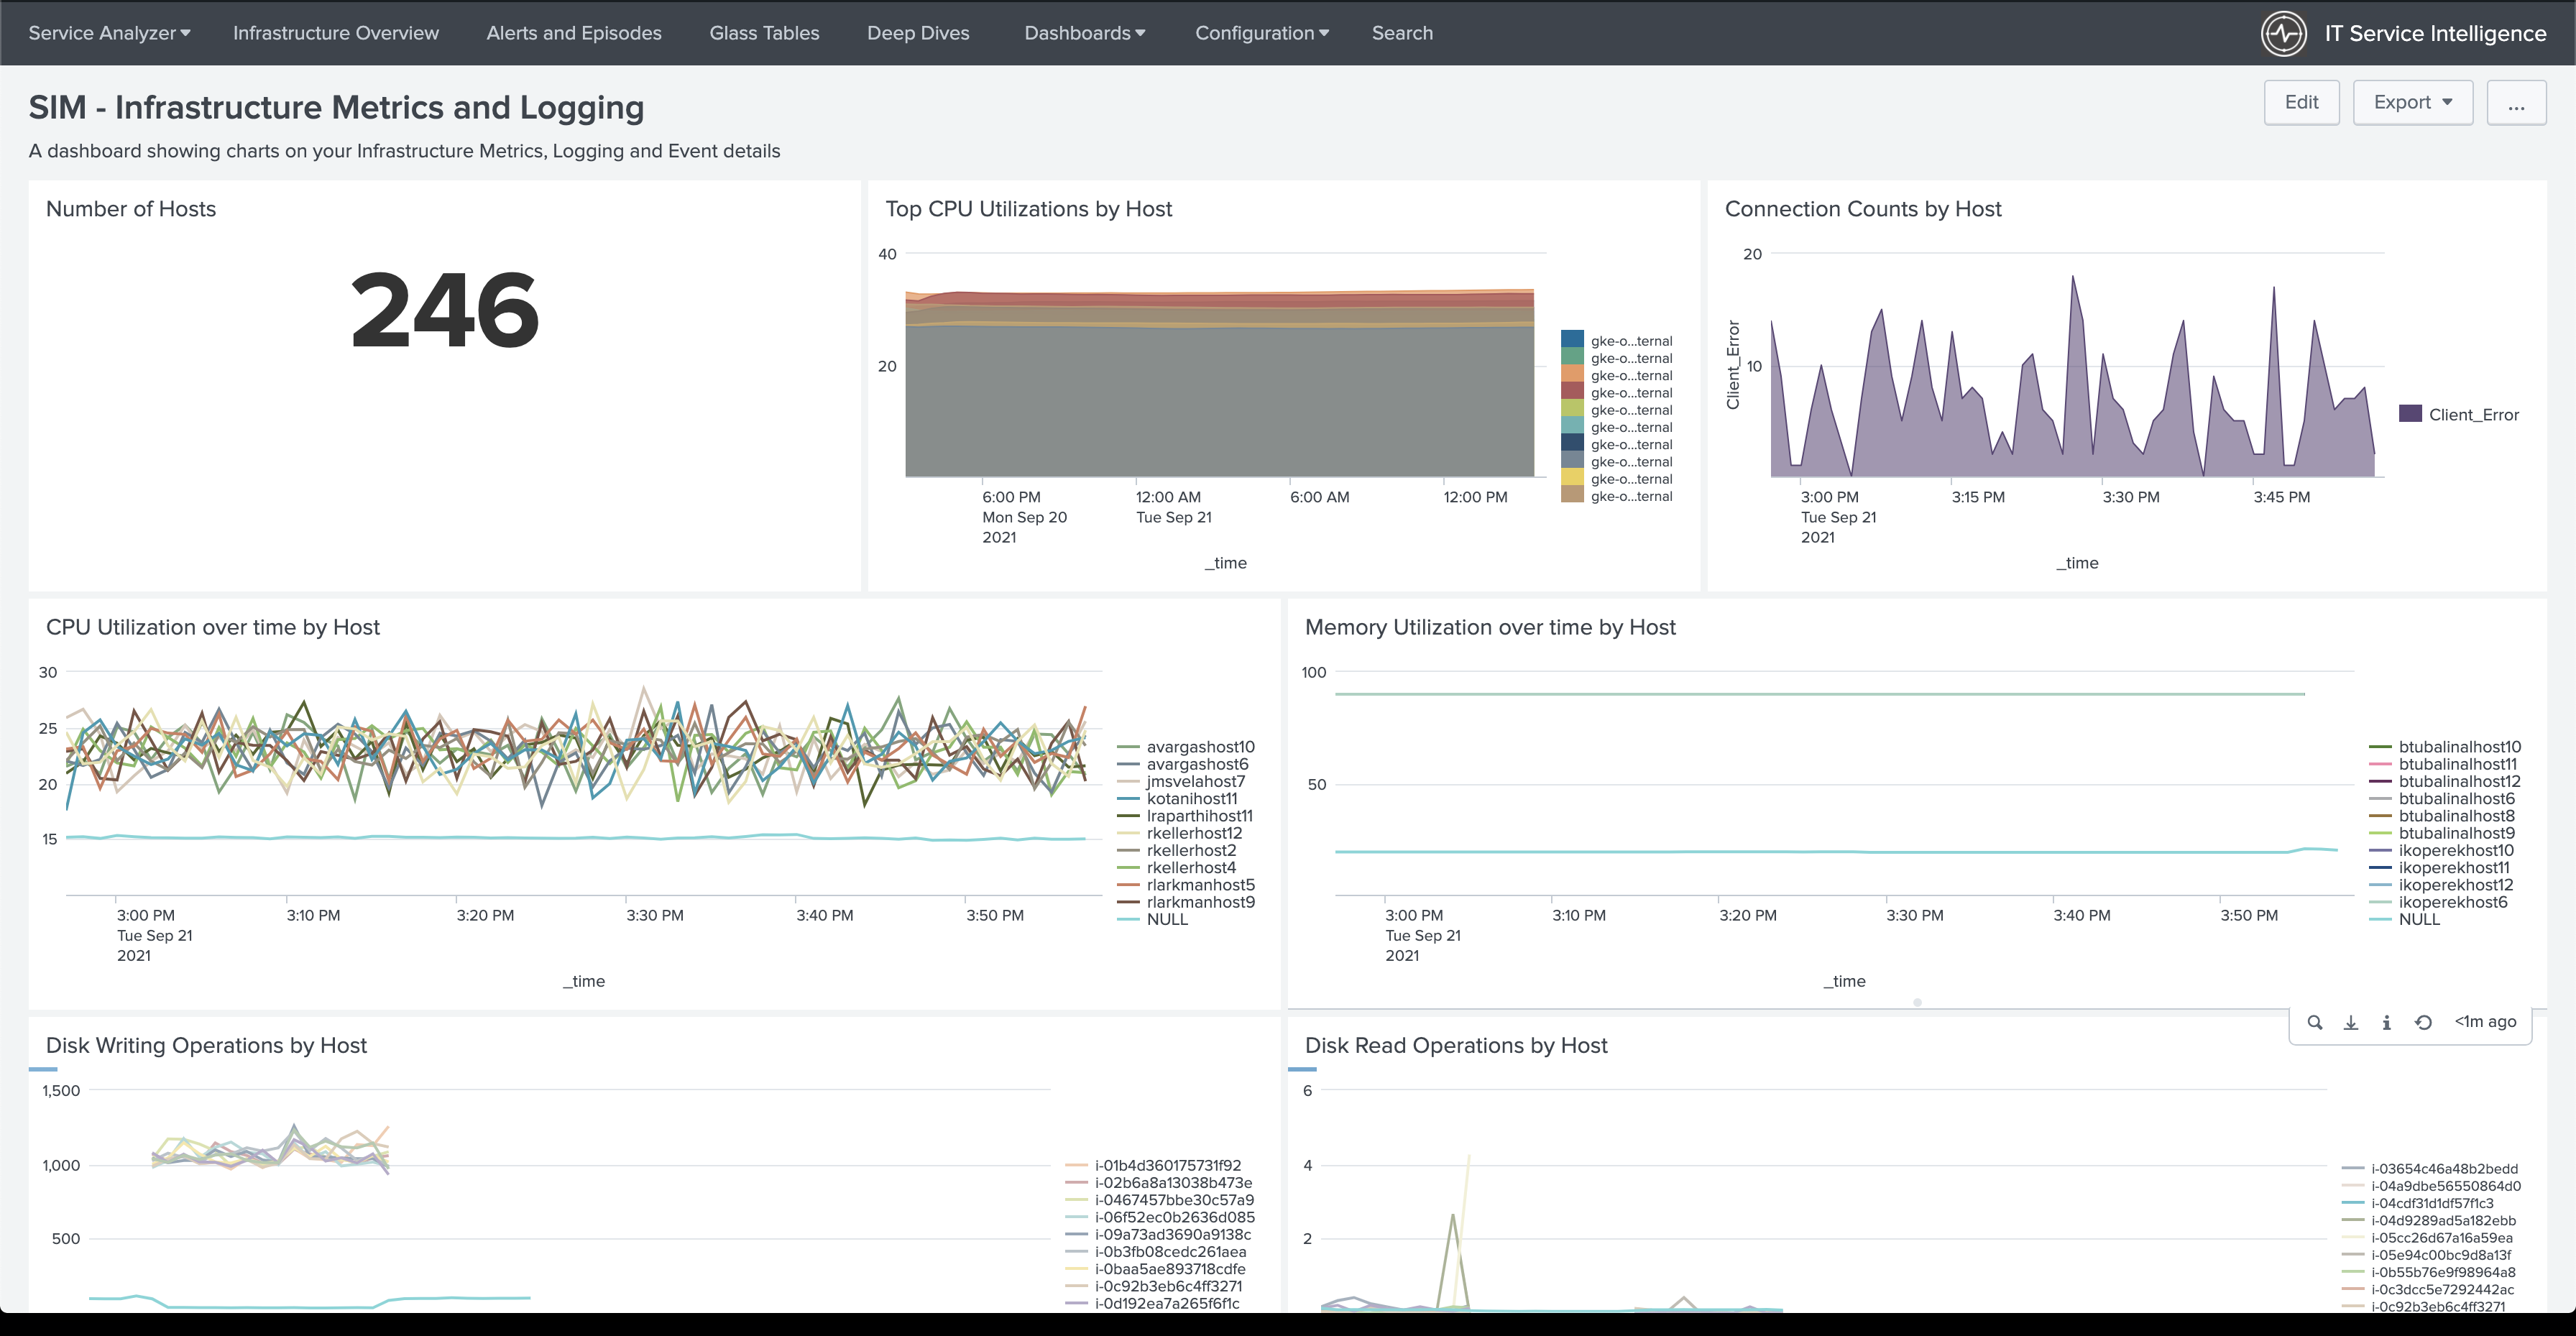
- Splunk Observability - SIM Infrastructure Metrics and Logging: Includes charts on your infrastructure metrics, logs, and events.
To view the Splunk Observability Cloud dashboards follow these steps:
- Select Dashboards > Dashboards from the ITSI or the IT Essentials Work menu.
- Enter "Splunk Observability" in the filter field to filter the list of dashboards.
- Select a dashboard to view.
- (Optional) From the Edit menu you can edit or clone the dashboard to customize it to meet your needs.
| Install and configure the Content Pack for Splunk Observability Cloud | Migrate from the Content Pack for Splunk Infrastructure Monitoring to the Content Pack for Splunk Observability Cloud |
This documentation applies to the following versions of Content Pack for Splunk Observability Cloud: 3.0.0
 Download manual
Feedback submitted, thanks!