Use the Content Pack for ServiceNow
After you install and configure the content pack, you can immediately start monitoring your ServiceNow instances. The content pack contains several useful views and dashboards that provide visibility into the different metrics of your ServiceNow instances.
Monitor ServiceNow's overall performance
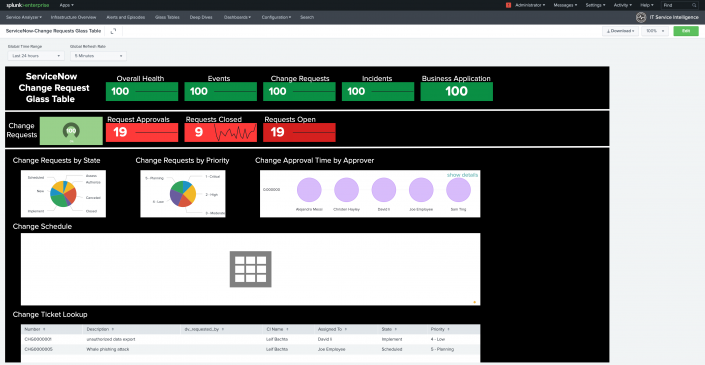
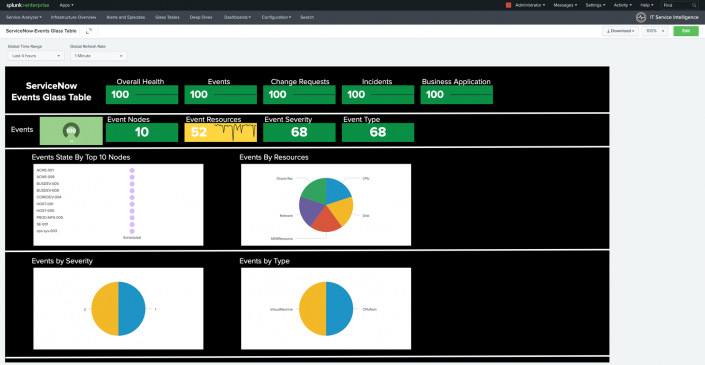
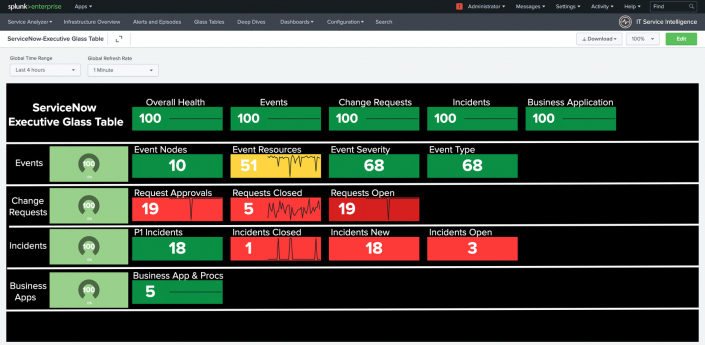
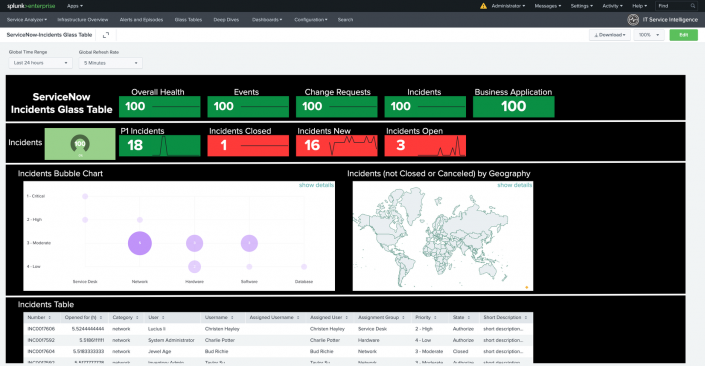
There are four glass tables that you can use to monitor your ServiceNow performance at a high level. Select Glass Tables from the ITSI menu and select a glass table to view. From the Edit menu, you can edit or clone the glass table to customize it to meet your needs.
ServiceNow-Change Requests Glass Table
ServiceNow-Events Glass Table
ServiceNow-Executive Glass Table
ServiceNow-Incidents Glass Table
Monitor your ServiceNow services
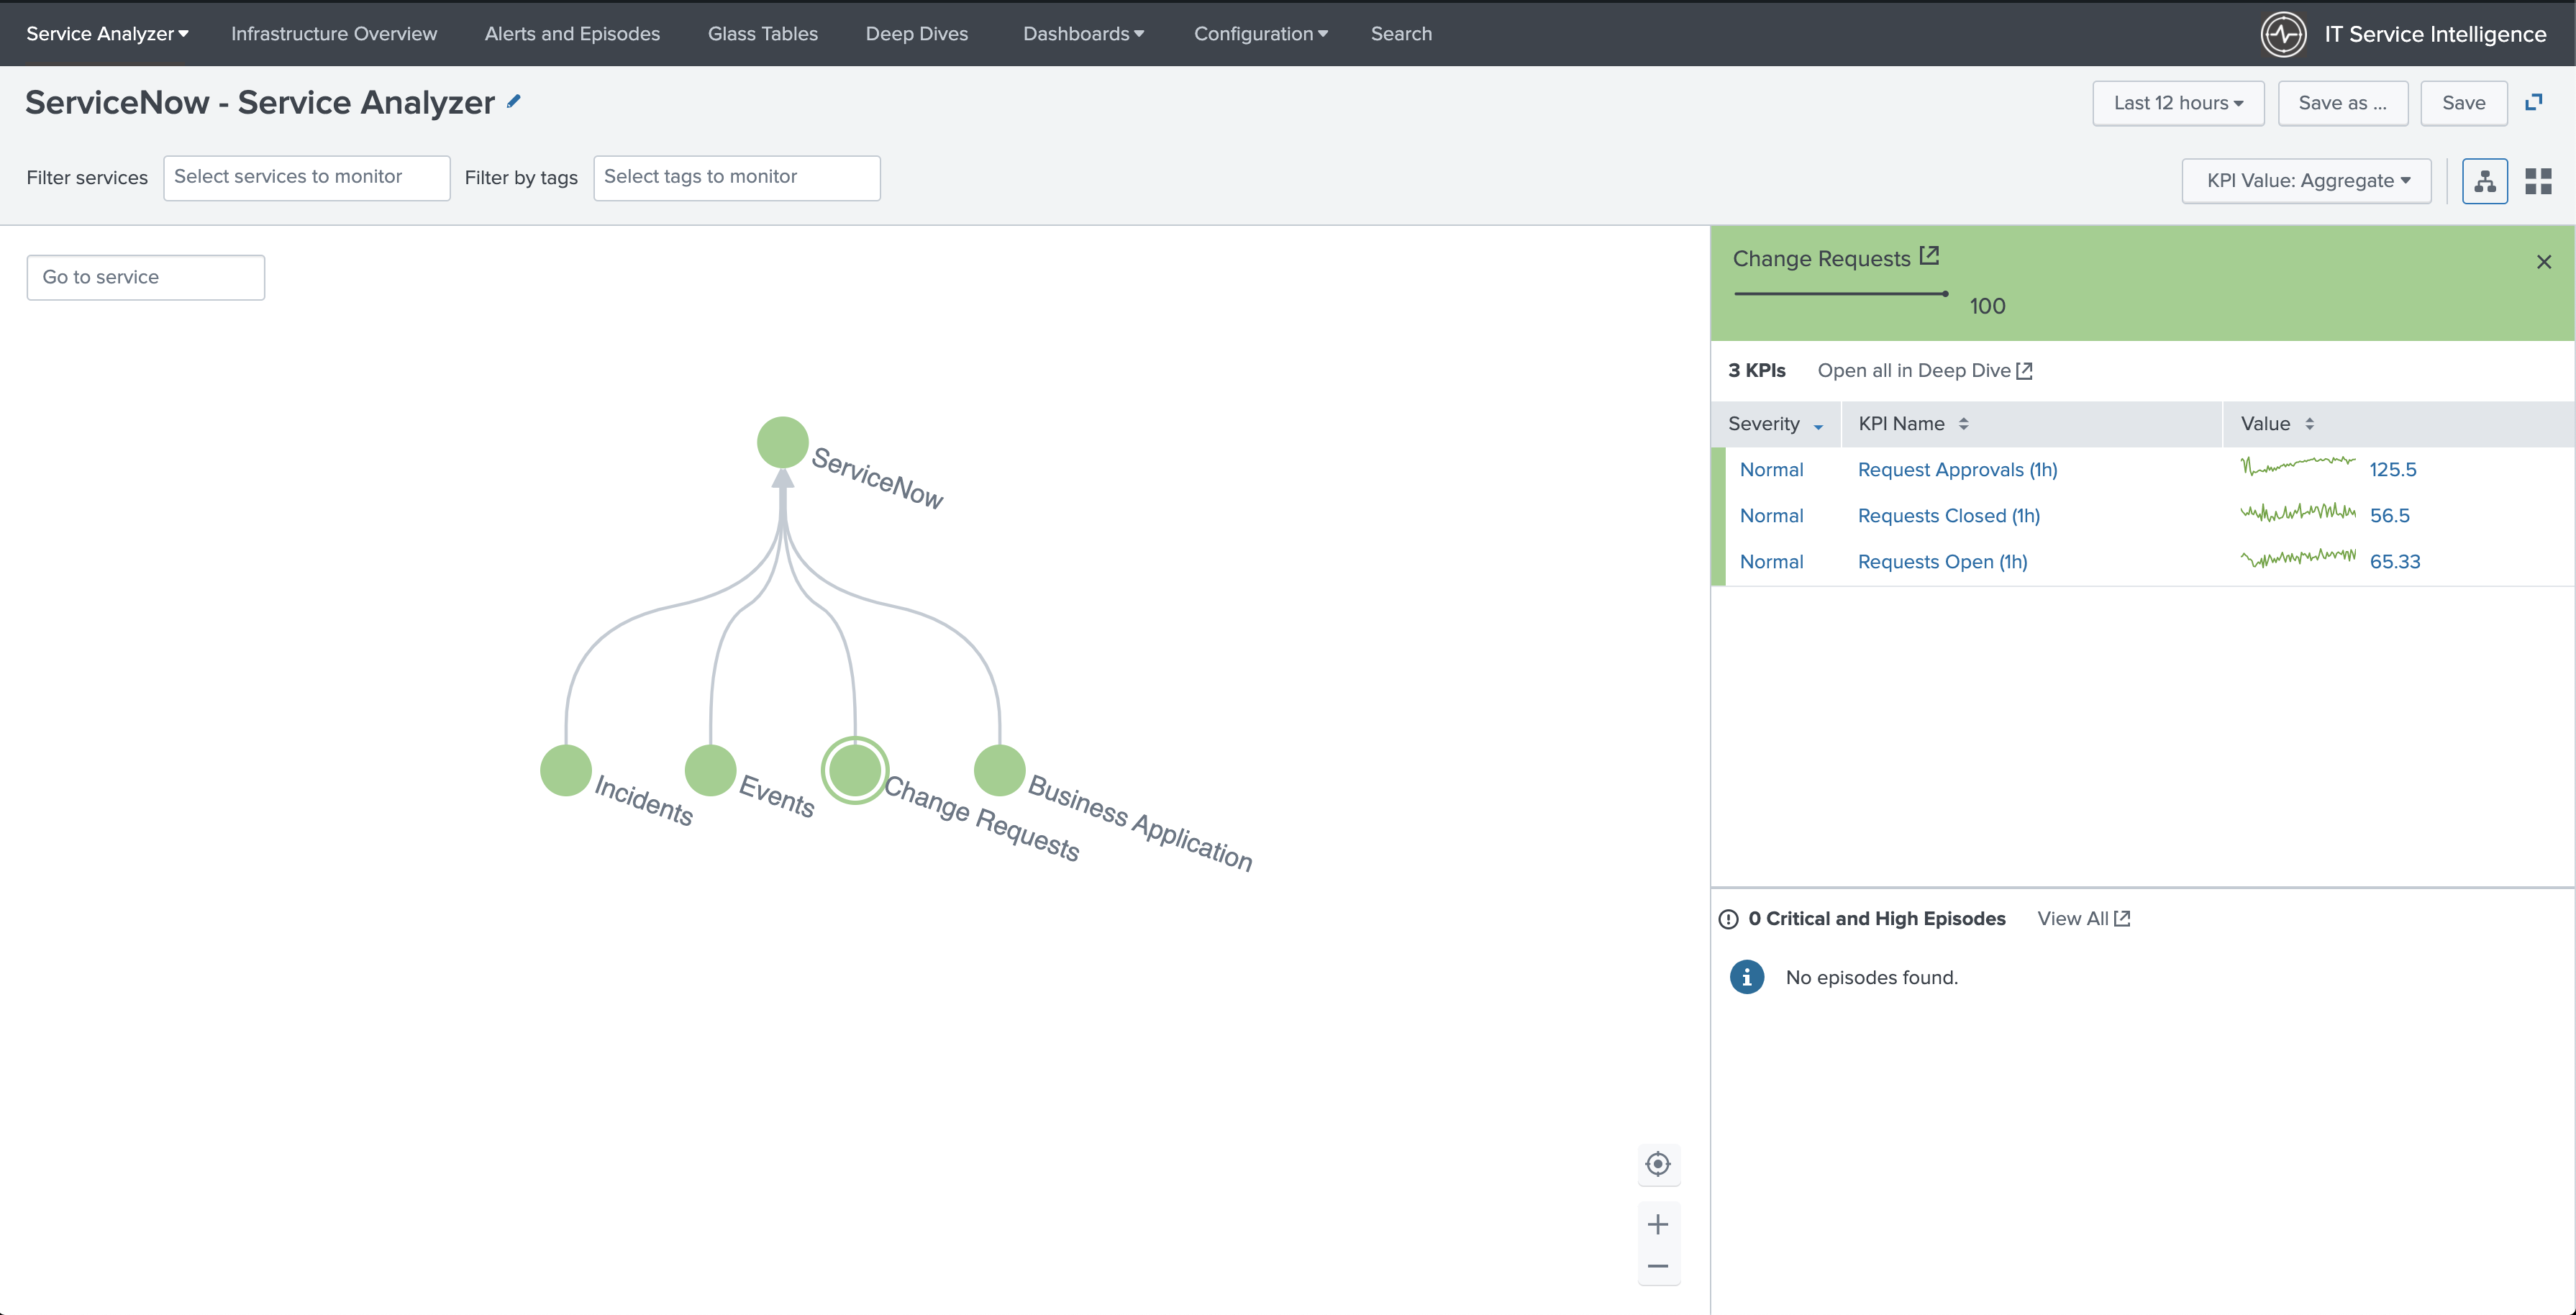
The ServiceNow - Service Analyzer included in this content pack provides instant, real-time visibility into the performance of your ServiceNow instances.
To access the custom ServiceNow - Service Analyzer, follow these steps:
- From the ITSI menu, select Service Analyzer > Analyzers.
- Select ServiceNow - Service Analyzer from the list of analyzers.
Monitor your ServiceNow entities
The content pack includes the four entity types that group entities originating from ServiceNow.
- SNOW CMDB
- SNOW Change Request
- SNOW Event
- SNOW Incident
Each entity type contains a set of vital metrics. Vital metrics are statistical calculations based on SPL searches that represent the overall health of entities of that type. To view the Entity Health page for the entity type, follow these steps:
- From the ITSI menu or IT Essentials Work menu, select Infrastructure Overview.
- Select GroupBy: Entity Type.
- Select the entity type to drill down into its vital metrics.
For more information about entity types and vital metrics, see Overview of entity types in ITSI in the Entity Integrations manual.
Entity dashboards
You can select an individual entity on the Entity Health page to drill down further into its performance metrics and log events. The Event Data Search dashboard displays the most recent log events associated with an entity over the last hour. The Analytics dashboard lets you view the trend of data coming in from each host by source type in a single snapshot.
To learn more about the available entity dashboards, see the following resources:
- To use the Event Data Search, see Event Data Search dashboard in ITSI.
- To use the Analytics dashboard, see Analyze entity performance metrics in ITSI.
Use ServiceNow dashboards
The content pack includes ten dashboards.
- ServiceNow - Auto-Created Incidents
- ServiceNow - Change Performance
- ServiceNow - Change Tasks
- ServiceNow - CMDB
- ServiceNow - CMDB Overview
- ServiceNow - Events
- ServiceNow - Incident Performance
- ServiceNow - Incidents Inspector
- ServiceNow - Open Incidents by Geography
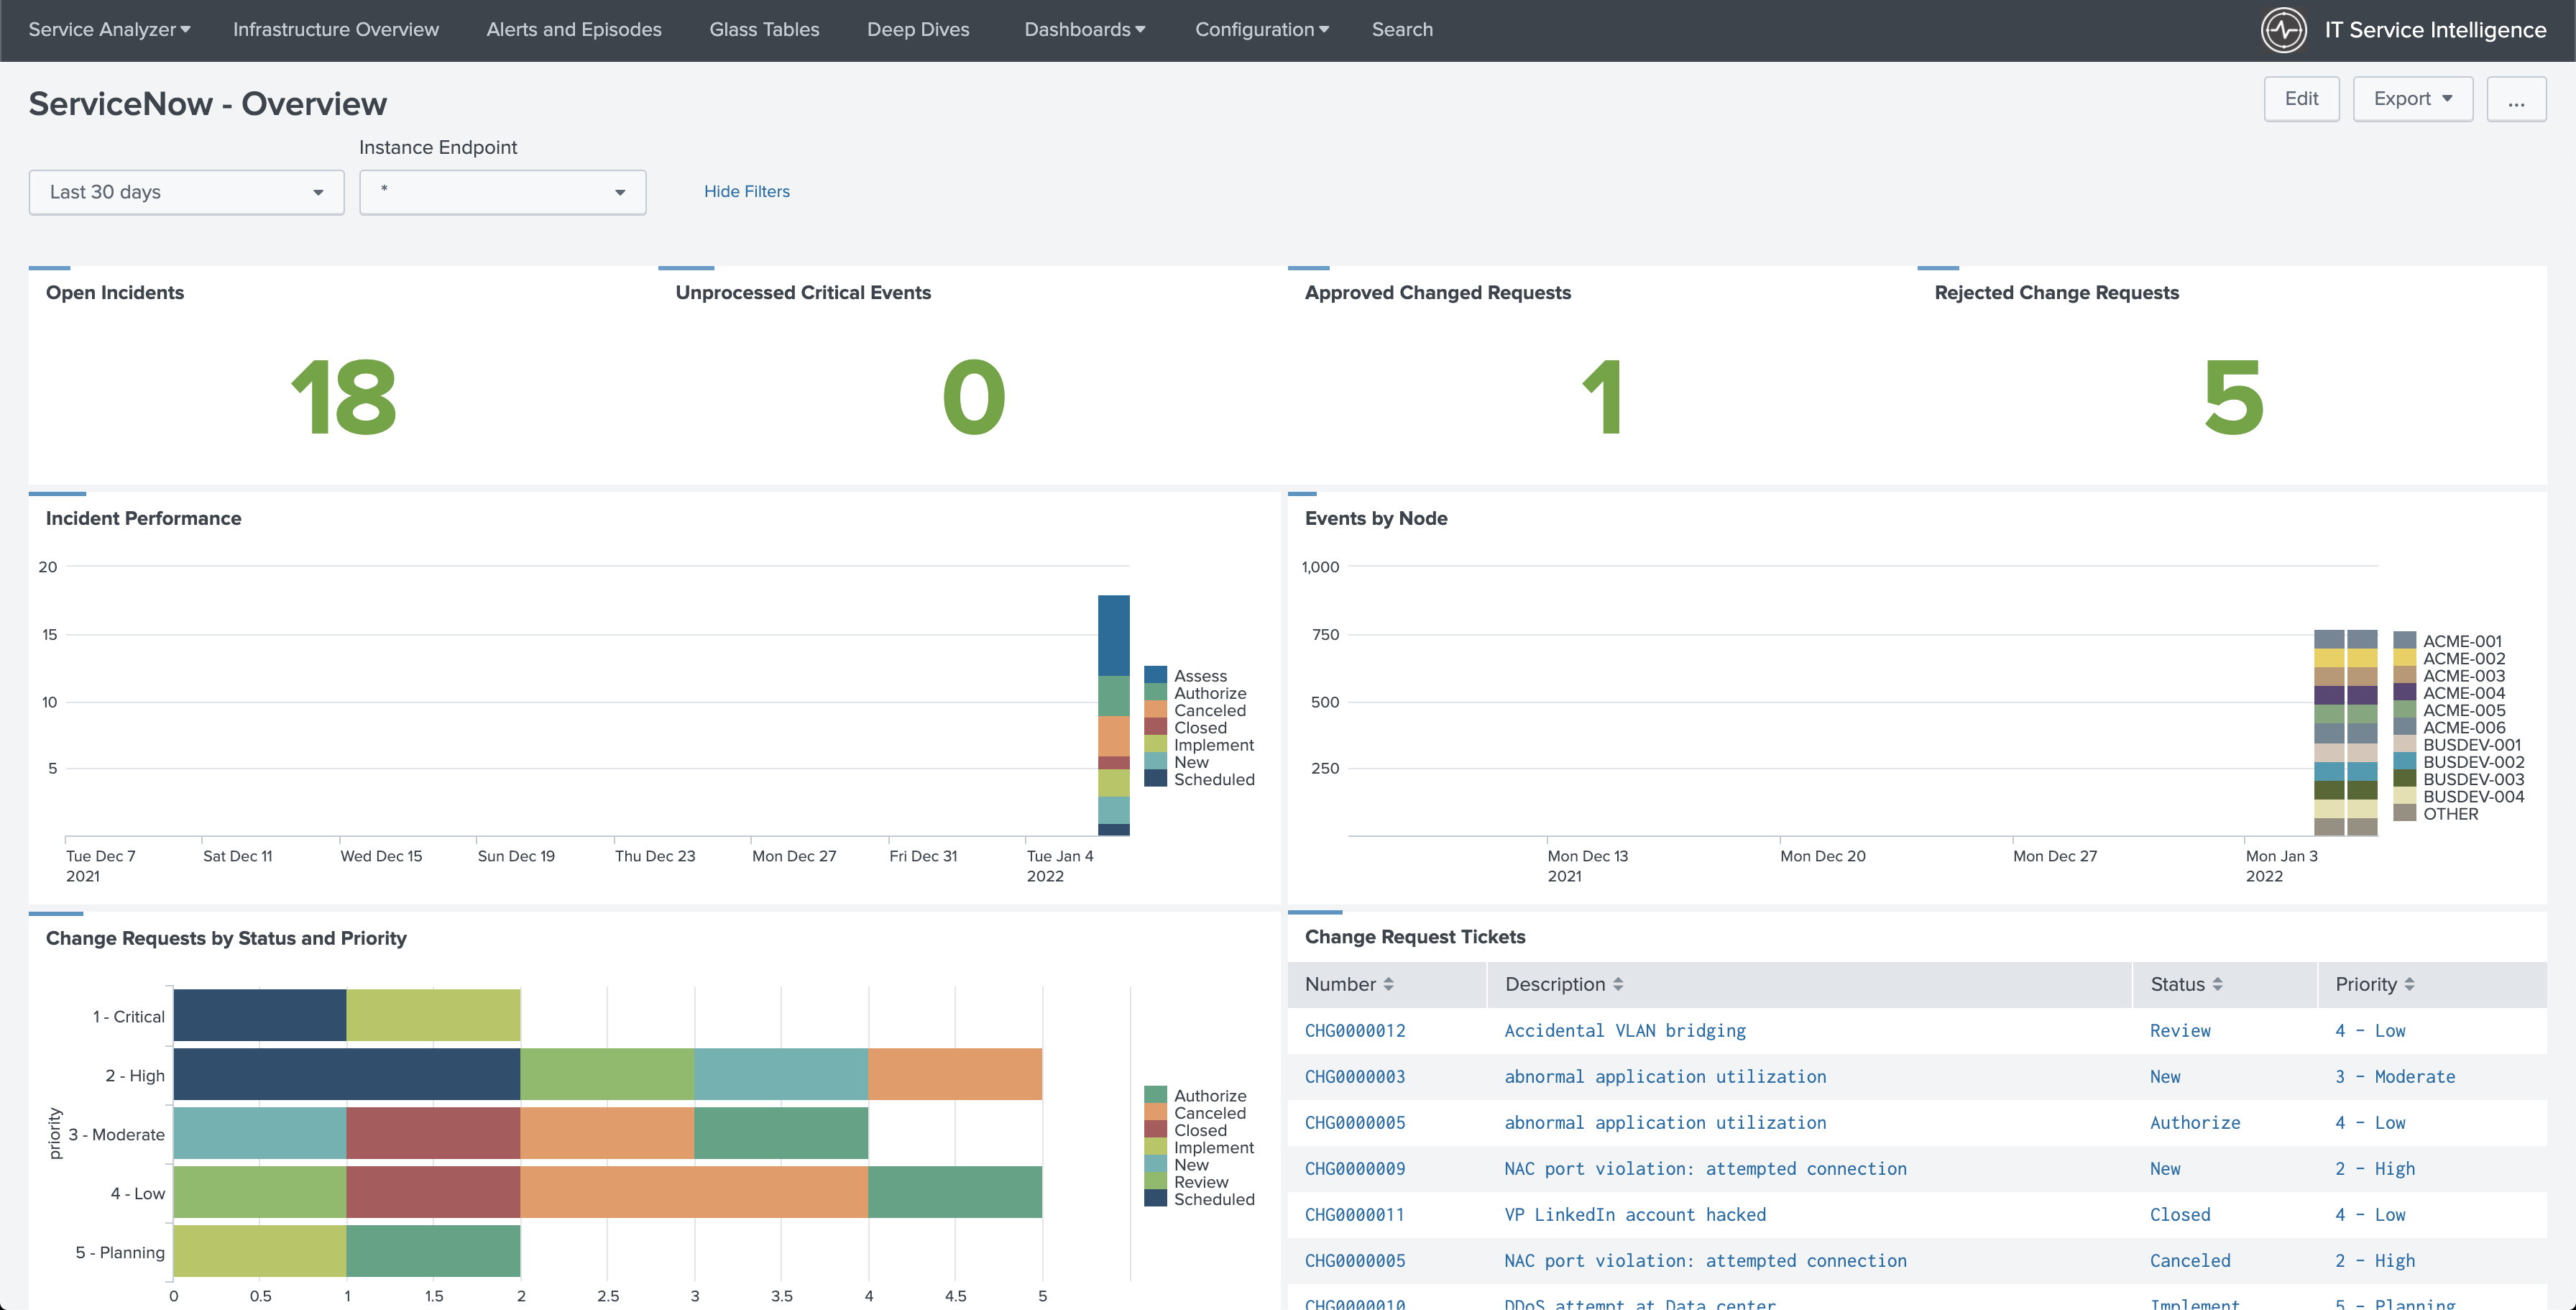
- ServiceNow - Overview
To view the ServiceNow dashboards, follow these steps:
- Select Dashboards > Dashboards from the ITSI menu or the ITE work menu.
- Enter "ServiceNow" in the filter field to filter the list of dashboards.
- Select a dashboard to view.
- (Optional) From the Edit menu, you can edit or clone the dashboard to customize it to meet your needs.
| Install and configure the Content Pack for ServiceNow | KPI reference for the Content Pack for ServiceNow |
This documentation applies to the following versions of Content Pack for ServiceNow: 1.0.0
 Download manual
Feedback submitted, thanks!