Dashboard reference for the Content Pack for VMware Dashboards and Reports
The Content Pack for VMware Dashboards and Reports offers a variety of dashboards to give you insight into your virtual environment.. You can configure many of the dashboards included in the content pack. Refer to the following tables to learn more about each dashboard and the configurable input types by dashboard.
Access the dashboards
Perform the following steps to access the content pack dashboards:
- Log into Splunk Web.
- Select App > IT Service Intelligence or IT Essentials Work.
- From the navigation bar, select Dashboards > Dashboards.
- In the App column, dashboards listed as DA-ITSI-CP-vmware-dashboards are part of the Content Pack for VMware Dashboards and Reports.
Capacity Forecasting dashboard
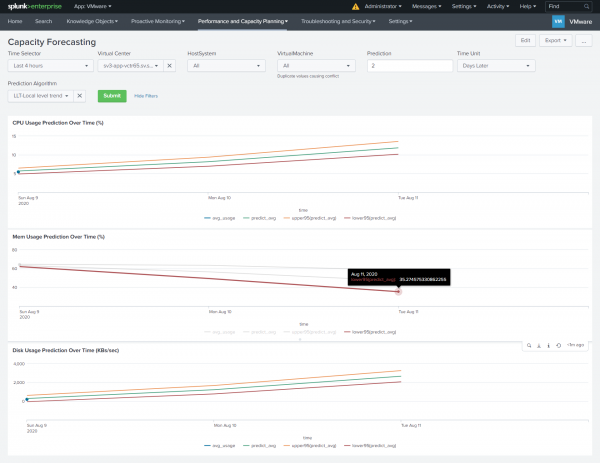
Use capacity forecasting to predict resource usage for different entities in your environment. Predicted results are based on historical values. Using these predictions you can optimize your environment for peak performance and be prepared in advance for unexpected usage periods.
Using the Capacity Forecasting dashboard, you can make predictions on the following resources:
- CPU usage over a specified time.
- Memory usage over time.
- Disk usage over time.
The following image shows the Capacity Forecasting dashboard with example data:
Capacity Forecasting dashboard fields
The dashboard includes several fields through which you refine the results displayed on the dashboard panels. The following drop-down fields are available on the dashboard:
| Field name | Description |
|---|---|
| Time Selector | Select a time range for the search. |
| Virtual Center | Select a specific virtual center in your environment. |
| HostSystem | Select all host systems managed by the virtual center or select a specific host system. |
| VirtualMachine | Select all virtual machines or select a specific virtual machine. |
| Prediction | Set a prediction time. A value of "0" indicates current time. A value of "1" indicates that you want to predict resource usage for 1 "time unit" from now. |
| Time Unit | Select a time unit, such as minutes, days, weeks, or months into the future. |
| Prediction Algorithm | Select one of the available forecasting algorithms:
|
For more information on the available forecasting algorithms used, see the Predict search command in the Splunk Enterprise Search Reference manual.
Capacity forecasting dashboard panels
The Capacity Forecasting dashboard provides panels with charts that show the predicted usage of a CPU, memory, or disk resource. In each of the charts the lower and upper confidence interval parameters default to lower95 and upper95. This specifies a confidence interval where 95% of the predictions are expected to fall.
The vmw:perf:* source type must be present for the panels to populate.
The following panels are available on the dashboard:
| Panel name | Description |
|---|---|
| CPU Usage Prediction over Time (%) | Displays predicted cpu usage for a host system, or all of the host systems in a virtual center over the time range specified. CPU usage prediction is calculated as a percent value using the "cpu.average.usage.percent" metric. |
| Mem Usage Prediction over Time (%) | Displays predicted memory usage for a host system, or all of the host systems in a virtual center over the time range specified. Memory usage prediction is calculated as a percent value using the "mem.average.usage.percent" metric. |
| Disk Usage Prediction over Time (KBs/sec) | Displays predicted disk usage for a virtual machine or all the virtual machines in a virtual center over the time range specified. Disk Usage Prediction is calculated in KB/sec using the "disk.average.usage.kiloBytesPerSecond" metric. |
Capacity Planning (Clusters) dashboard
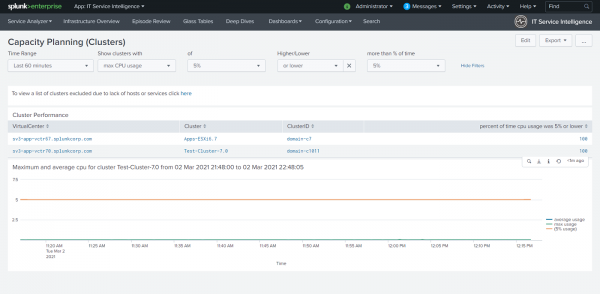
Use the Capacity Planning (Clusters) dashboard to monitor and plan the allocation of resources for virtual machines in your cluster. Using this dashboard you can see memory and CPU resource utilization for specific clusters, and you can identify clusters that are nearing maximum capacity for a specific resource.
CPU utilization is expressed as a percentage of time (0 to 100%) that the CPU executes at the threshold you define.
You can also view a list of clusters excluded due to lack of hosts or services. These are clusters that do not support cluster services and contain less than two hosts.
The following image shows the Capacity Planning (Clusters) dashboard with example data:
Capacity Planning (Clusters) dashboard fields
The dashboard includes several fields through which you refine the results displayed on the dashboard panel. The following drop-down fields are available on the dashboard:
| Field name | Description |
|---|---|
| Time Range | Select a time range for the search. |
| Show clusters with | Select the key performance metric of max CPU usage or max Memory usage, for the search. |
| of | Define a usage percent for a resource. |
| Higher/Lower | Specify whether you want the search to include results that are higher or lower than the usage percent specified. |
| more than % of time | Define a percentage of time over which the resource is used. |
Cluster Performance panel
Use the drop-down lists at the top of the dashboard to filter the results shown in the Cluster Performance panel. You can use the results in the table to monitor the activity of certain clusters or better provision CPU and memory resources on a cluster.
You can click any cluster in the panel table to display a chart that shows the performance of that cluster in relation to the threshold you set for that metric.
The following metrics are used to populate the dashboard:
| Name | Metric | Description |
|---|---|---|
| max cpu usage | clusterServices.average.effectivecpu.megaHertz | The average CPU usage of the ESXi host as a percent value. |
| max memory usage | mem.average.usage.percent | The average memory usage of the ESXi host as a percent value. |
Capacity Planning for Clusters - CPU Headroom dashboard
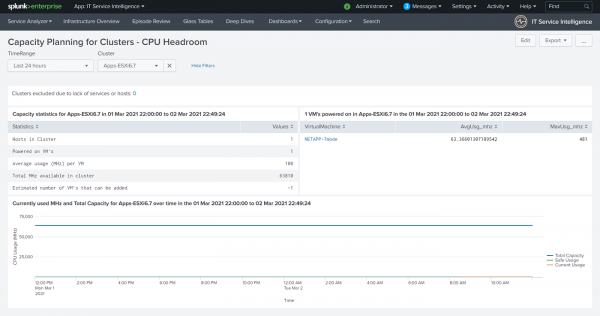
Use the Capacity Planning for Clusters - CPU Headroom dashboard to get an estimate for the number of virtual machines that you can add to the cluster, based on current CPU consumption of the ESXi hosts, and total CPU capacity allocated to virtual machines in the cluster.
This dashboard only reports on powered-on virtual machines in the cluster.
The Capacity Planning for Clusters - CPU Headroom dashboard displays the following:
- Capacity statistics for a cluster.
- A list of powered-on virtual machines and their CPU usage in the cluster.
- A chart showing current CPU usage, safe CPU usage, and total CPU capacity for the cluster.
You can view a list of clusters excluded due to lack of hosts or services. These are clusters that don't support cluster services and contain less than two hosts.
Capacity Planning for Clusters - CP Headroom dashboard fields
The dashboard includes two fields through which you refine the results displayed on the dashboard panels. Make selections on the following drop-down fields at the top of the dashboard:
- Select a time range.
- Select a cluster name.
The following image shows the Capacity Planning for Clusters - CPU Headroom dashboard with example data:
Capacity Planning for Clusters - CP Headroom dashboard panels
The following dashboard panels populate once a date and cluster are selected:
| Panel name | Description |
|---|---|
| Capacity statistics | Displays the number of hosts in the cluster, the number of powered-on virtual machines, The average CPU usage in MHz per virtual machine, total CPU usage MHz available in cluster, and the estimated number of virtual machines that can be added to the cluster. |
| Powered-on virtual machines in the cluster | Table displays the powered-on virtual machines in the cluster and the average and maximum CPU usage in MHZ for each virtual machine. |
| Currently used MHz and total capacity | Chart displays the total capacity of the cluster, the current cpu usage of the cluster, and safe usage over the time period specified. |
The following metrics are used to calculate CPU utilization:
| Name | Metric |
|---|---|
| CPU usage for the cluster | clusterServices.average.effectivecpu.megaHertz |
| Average cpu usage (MHz) | mem.average.usage.percent |
| Maximum cpu usage (MHz) | cpu.maximux.usagemhz.megaHertz |
| Minimum cpu usage (MHz) | cpu.minimum.usagemhz.megaHertz |
Capacity Planning for Clusters - Memory Headroom dashboard
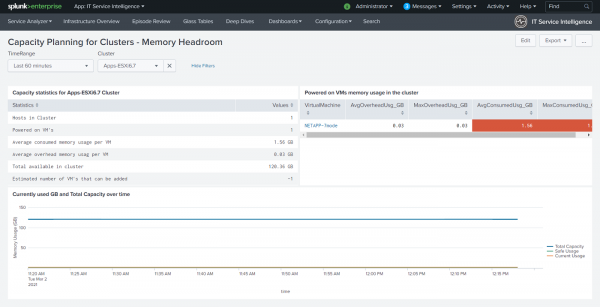
Use the Capacity Planning for Clusters - Memory Headroom dashboard to get an estimate for the number of virtual machines that you can add to the cluster based on current memory consumption and overhead memory allocated to the virtual machines in the cluster.
This dashboard reports only on powered-on virtual machines in the cluster.
You can use this dashboard to help make better resource provisions, minimize and resolve bottlenecks, increase the availability of systems, and improve overall performance of the systems.
The Capacity Planning for Clusters - Memory Headroom dashboard displays the following:
- Capacity statistics for the cluster.
- A list of powered-on virtual machines showing their memory usage in the cluster.
- A chart showing current memory usage (in GB) for the cluster, and total memory capacity for the cluster.
Capacity Planning for Clusters - Memory Headroom dashboard fields
The dashboard includes two fields through which you refine the results displayed on the dashboard panels. Make selections on the following drop-down fields at the top of the dashboard:
- Select a time range.
- Select a cluster.
The following image shows the Capacity Planning for Clusters - Memory Headroom dashboard with example data:
Capacity Planning for Clusters - Memory Headroom dashboard panels
The following dashboard panels populate once a date and cluster are selected:
| Panel name | Description |
|---|---|
| Capacity statistics for the cluster | Displays the number of hosts in the cluster, the number of powered-on virtual machines, the average consumed memory in GB per virtual machine, the average overhead memory usage in GB per virtual machine, .the total memory available in GB in the cluster, and the estimated number of virtual machines that you can add to the cluster. |
| Powered on virtual machines memory usage in the cluster | Displays the memory usage for each powered-on virtual machine in the cluster. Virtual machine memory overhead is the amount of machine memory allocated to a virtual machine beyond its reserved amount. |
| Currently used GB and Total Capacity over time | Displays the total capacity of the cluster, the current CPU usage of the cluster, and safe usage over the time period specified. |
The following metrics are used to calculate dashboard results:
| Metric | Description |
|---|---|
| AvgOverheadUsg_GB | Metric used to measure the memory used by VMware to actually power the virtual machine. |
| MaxOverheadUsg_GB | Metric used to measure the maximum memory used by VMware to actually power the virtual machine, over the summarization period. |
| AvgConsumedUsg_GB | Metric used to measure the average memory consumed by the virtual machine in the cluster. |
| MaxConsumedUsg_GB | Metric used to measure the maximum amount of memory consumed by a virtual machine over the summarization period. |
Capacity Planning (Hosts) dashboard
Use the Capacity Planning (Hosts) dashboard to monitor the performance and plan the allocation of resources to hosts in your environment. This dashboard uses VMware's key performance counters to show the performance of hosts over time based on the memory or CPU resources used. You can use the dashboard panel results to provision your hosts and virtual machines with the correct amount of physical memory and CPU resources.
Capacity Planning (Hosts) dashboard fields
At the top of the dashboard, create a search using the drop-down lists on the dashboard. The following fields are available:
| Field name | Description |
|---|---|
| Time Range | Select a time range for the search. |
| Show hosts with | Select the key performance metric of max CPU usage or max Memory usage, for the search. |
| of | Define a usage percent for a resource. |
| Higher/Lower | Specify whether you want the search to include results that are higher or lower than the usage percent specified. |
| more than % of time | Define a percentage of time over which the resource is used. |
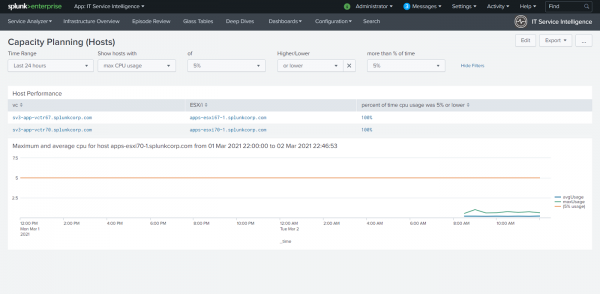
The following image shows the Capacity Planning (Hosts) dashboard with example data:
Host Performance panel
Use the drop-down lists at the top of the dashboard to filter the results shown in the Host Performance panel. Click a host in the results table to chart the individual host performance. The average and maximum usage for the performance category (mem or CPU) for the host is displayed in relation to the threshold you defined.
The following metrics are used to populate the dashboard:
| Name | Metric | Description |
|---|---|---|
| max cpu usage | cpu.average.usage.percent | The average CPU usage of the ESXi host as a percentage value. |
| max memory usage | mem.average.usage.percent | The average memory usage of the ESXi host as a percentage value. |
Cluster Detail dashboard
Use the Cluster Detail dashboard to see the details for a specific cluster over a selected time range.
Using this dashboard you can perform the following tasks:
- Get a quick view of the state of the hosts in the cluster.
- Identify the root cause of issues in the cluster.
- Check how the cluster performs against key performance metrics.
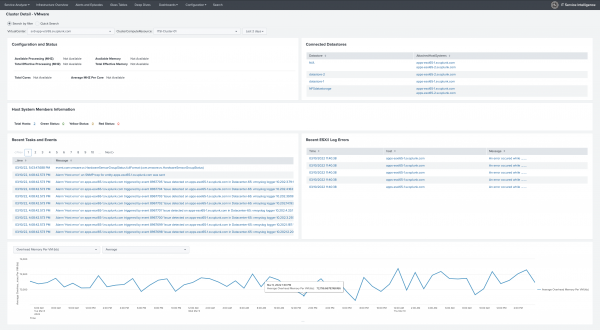
The following image shows the Cluster Detail dashboard with example data:
Cluster Detail dashboard panels
The following dashboard panels populate once you select from the VirtualCenter and ClusterComputeResource drop-down fields, and select a time range:
| Panel name | Description |
|---|---|
| Cluster Configuration and Status | View basic configuration information about the state of the cluster including the status of the cluster, available and total processing power (in MHZ) for the cluster, available and total memory (in MB) for the cluster, the total number of cores assigned to the cluster, and the processing power of each (in MHZ). |
| Connected Datastores | View a list of datastores connected to the host systems in the cluster. Click the datastore name to see the specific details for that datastore, as shown on the Datastore Detail dashboard. Get visibility into the file types residing on that datastore. Use this information to plan your storage requirements for the cluster. |
| Host System Members Information | View high-level information about the host systems in the cluster including the total number of hosts and the roll-up status of hosts that are in the normal, warning, and critical states for the thresholds defined.
To see more details for each host system, click on the value associated with the field. |
| Recent Tasks and Events | View recent tasks and events that have occurred on the cluster. This panel lists all completed tasks on the cluster. The task list includes tasks performed on the host systems. Use this information to investigate the root cause of problems in your cluster. You can isolate problems down to the task that caused it. |
| Recent ESXi Log Errors | View the log files generated by VMware ESXi hosts in the cluster. ESXi host logs are written to the file system and provide information about system operational events.You can examine the log files in detail drilling down to system events that can identify particular issues in your environment. |
| Chart of performance data for a cluster | Use this chart to see the performance of the cluster for a specific performance data type. Filter the results by selecting a performance metric and then selecting the statistical operation on the data. |
Datastore Detail dashboard
Use the Datastore Detail dashboard to access information about the storage layer in your environment. Using this dashboard you can perform the following tasks:
- Monitor the most important performance metrics such as latency and IOPS for the connected datastore, at the filer and at the volume level.
- Correlate virtual machine performance with storage performance, specifically NetApp storage.
- Reduce the time it takes to identify a problem if storage performance degradation affects all of the hosts or some of the virtual machines on a particular datastore.
Dashboard panels populate once you select from the VirtualCenter and Datastore drop-down fields, and select a time range from the top of the dashboard. The following dashboard panels are included:
- Configuration and Status
- Virtual Machine Storage Consumption
Configuration and Status panel
Use the information on this panel to review the configuration and status of the datastore. On this panel you can view the following information about the state of the datastore:
- If the datastore is accessible
- Volume type
- Available space and total space, in GB, on the datastore
- Space provisioned, in GB, for a virtual machine, and the percent over-provisioned
- Path to the datastore and the associated URL
- Number of virtual machines on the datastore
Virtual Machine Storage Consumption panel
Use this panel to access, and assess consumption rates in your environment. Over-consumption can lead to performance issues.
Get Datastore Filer Latency rate
Storage latency and latency rate is a contributing factor to reduced performance in your environment. Spikes in latency rates can warrant further investigation.
Filer latency rates are measured by monitoring performance metrics that track average reads and writes to the filer. Measuring latency can prevent performance problems in the application layer.
The following search is used to populate the panel:
| tstats values(NetAppPerformance.System_Performance.sys_read_latency_average) as read_latency, values(NetAppPerformance.System_Performance.sys_write_latency_average) as write_latency from datamodel=NetApp_ONTAP groupby _time, host span=2m | search [search `SystemHostname($filer[0].Filer$)`] | timechart avg(read_latency) AS read_latency, avg(write_latency) AS write_latency | eval read_latency=read_latency/1000 | eval write_latency=write_latency/1000
Get Datastore Filer IOPS rate
Use this panel to monitor filer IOPS information. You can get poor virtual machine performance if your virtual machines don't have enough I/O per second (IOPS), or network throughput.
The following search is used to populate the panel:
| tstats values(NetAppPerformance.System_Performance.read_ops_rate) as read_ops_rate, values(NetAppPerformance.System_Performance.write_ops_rate) as write_ops_rate, values(NetAppPerformance.System_Performance.total_ops_rate) as total_ops_rate from datamodel=NetApp_ONTAP groupby _time,host span=5m | search [search `SystemHostname($filer[0].Filer$)`] | timechart avg(read_ops_rate) as read_ops_rate, avg(write_ops_rate) as write_ops_rate, avg(total_ops_rate) as total_ops_rate
Get Datastore Volume Latency rate
Use this panel to measure volume latency rates by monitoring performance metrics that track average reads and writes to the volume on the disk.
The following search is used to populate the panel:
`ontap-index` sourcetype=ontap:perf source=VolumePerfHandler host=$volume[0].Filer$ instance_name=$volume[0].Volume$ | timechart limit=5 first(eval(avg_latency_average/1000)) as avg_latency_average first(eval(other_latency_average/1000)) as other_latency_average first(eval(write_latency_average/1000)) as write_latency_average first(eval(read_latency_average/1000)) as read_latency_average by instance_name
Get Datastore Volume IOPS rate
Use this panel to monitor volume IOPS. You can get poor virtual machine performance if your virtual machines do not have enough I/O per second (IOPS).
The following search is used to populate the panel:
`ontap-index` sourcetype=ontap:perf source=VolumePerfHandler host=$volume[0].Filer$ instance_name=$volume[0].Volume$ | timechart limit=5 first(total_ops_rate) as total_ops_rate first(write_ops_rate) as write_ops_rate first(read_ops_rate) as read_ops_rate first(other_ops_rate) as other_ops_rate by instance_name
Correlate VMware data with NetApp ONTAP storage data
Issues in the storage layer can impact the performance of virtual machines in your environment. You can correlate issues in your VMware infrastructure with NetApp storage issues using the Datastore Detail dashboard. This correlation feature enables you to better troubleshoot problems in your infrastructure and identify where the problems exist between the VMware hosts and your NetApp ONTAP filers.
For example, if virtual machines on an NFS datastore named "ISO" in the Content Pack for VMware Dashboards and Reports cause a problem in your environment, you can drill down to the filer and the specific volume in the Content Pack for NetApp Data ONTAP Dashboards and Reports and look at the performance information for the datastore known in your VMware environment as "ISO".
Correlation requirements
To correlate VMware data with NetApp ONTAP data, you must have the following Content Packs installed in your environment:
- Content Pack for VMware Dashboards and Reports
- Content Pack for NetApp Data ONTAP Dashboards and Reports
The correlation feature enables you to drill down from a dashboard in the Content Pack for VMware Dashboards and Reports to the Content Pack for NetApp Data ONTAP Dashboards and Reports and get specific filer and volume performance information.
To learn more about the Content Pack for VMware Dashboards and Reports, see Install and configure the Content Pack for VMware Dashboards and Reports.
To learn more about the Content Pack for NetApp Data ONTAP Dashboards and Reports, see Install and configure the Content Pack for NetApp Data ONTAP Dashboards and Reports.
Required sourcetypes
The following sourcetypes must be present for this dashboard to populate:
- The ontap:volume and ontap:perf sourcetypes must be present to get information about the volumes in the NetApp ONTAP environment.
- The vmware_inframon:inv:datastore sourcetype must be present to get information about the NFS volumes in the VMware environment.
Display filer volume level details
Drill down from the filer to the datastore level to see details for a specific filer volume.
To display volume level details:
- In the Datastore Filer Latency rate panel, click a filer name.
- The Filer View dashboard of the Splunk App for NetApp Data ONTAP is displayed.
- Look at the specific storage controllers that have an impact on the performance of your environment.
For information on this dashboard, see Controller View in the dashboard reference for the Content Pack for NetApp Data ONTAP Dashboards and Reports manual.
ESXi Hosts Task Overview dashboard
Use the ESXi Hosts Task Overview dashboard to get insights into the state of your virtual environment. Using this dashboard you can perform the following tasks:
- Get a quick view of the state of your host system, including visibility into the tasks performed on the hosts and the related virtual machines.
- Identify the root cause of issues on the host. Review the list of tasks to identify any anomalies in your environment.
Use the available fields at the top of the dashboard to narrow the results on the dashboard panels.
The following fields are available:
| Field name | Description |
|---|---|
| User | Search for a specific message relating to a user. |
| State | Specify an error state. |
| Description | Use this field to create a limit results to the hosts that have messages that match your search criteria. The search looks in the error messages returned in the syslog data for the word you enter. |
The source type vmware_inframon:tasks must be present for this dashboard to work correctly.
ESXi Log Browser dashboard
Use the ESXi Log Browser dashboard to view ESX/i logs collected from the host systems.
Use the available fields at the top of the dashboard to narrow the results on the dashboard panels. The following fields are available:
| Field name | Description |
|---|---|
| Time range | Select a time range for the search. |
| ESXi | List of ESXi hosts from which you are collecting syslog data. The default value is All. |
| Common terms | Common terms that exist in ESXi logs. This is a static list of options. The default value is Any. |
| Field/Value | Common field values extracted at index time from events. This is a static list of options. The default value is Any. |
| Error/Fault | Common errors of faults that appear in syslog data, classified into a single grouping. The default value is Any. |
| Managed Objects | A list of all objects managed by the vCenter Server. The default value is All. |
| API Related | List of all API related search terms that can appear in syslog data. The default value is All. |
| Component | List of all services running on the vCenter server. The default value is All. |
| Sublogger | List of the log listener services installed. The default value is All. |
| Look For | Enter the term that you want to specifically search for in the logs. |
| Level | A logging level. This can be DEBUG, INFO, WARN, ERROR, or FATAL. |
The resulting log data in the dashboard panels can be reviewed, and you can configure the forwarding of syslog data to the content pack. The dashboard includes the following panels:
| Panel name | Description |
|---|---|
| Vpxa | vCenter server vpxa agent logs (vpxa.log). These logs contain communication information with vCenter Server and the Host Management hostd agent. |
| Syslog | Syslog management service logs. |
| Hostd | hostd management service logs (hostd.log). The logs include virtual machine and host Task and Events information, information related to communication between the vSphere Client and the vpxa agent, and they store information about SDK connections. |
Home dashboard
Use the Home dashboard to view details about virtual machines and hosts that are in a critical state in your environment.
All of the panels in this dashboard, barring Recent Alarms, are driven by performance metrics. To check that you are receiving data, click the dashboard gauges to go to the Proactive Monitoring dashboard. Confirm the topology tree on that dashboard is built from data in your environment.
Home dashboard gauges
The Home dashboard is made up of several dashboard panels. The Virtual Machine Health and Host System Health panels report on key metrics that monitor the health of the virtual machines and hosts in your environment. Both of these panels display a series of gauges
Each gauge represents virtual machine and host entities that are in critical states. As metric values changes over time, the gauge markers changes position.
Each gauge displays a percentage (of the total number) of virtual machines and hosts that are in a critical state, over the time period specified, for the specific metric. This value is a numeric representation of the display on the gauge and is based on the same search used to drive the gauge. The numeric value is mapped against a range of colors.
A gauge that displays 0% indicates that none of the virtual machines or hosts in your environment are in a critical state for that metric.
A gauge can be in one of the following states. The states are driven by the thresholds you set:
- Red: Virtual machines or hosts are in a critical state for the metric.
- Orange: Virtual machines or hosts are in a warning state for the metric.
- Green: Virtual machines or hosts are in a normal state for the metric.
A gauge displays no data indicates that performance data is not collected from your environment and is not coming into Splunk.
Use the gauges to identify hosts or virtual machines in your environment that need immediate attention.
Example dashboard gauges
On the following dashboard image, the gauge for High CPU Usage shows a value of 0%. This 0% value indicates that none of the virtual machines in this environment are in a critical state for that metric. Each of the metrics measured has default thresholds defined in the Content Pack for VMware Dashboards and Reports. A value of 0% means that of all the performance data that is collected for all of the virtual machines, none of the virtual machines in this environment have a performance metric that meets the critical threshold level set for it.
Virtual Machine Health panel
The Virtual Machine Health panel includes the following components:
| Component name | Description |
|---|---|
| High CPU Usage gauge | The threshold for the metric average_cpu_usage_percent drives this gauge. This is the average CPU usage by the virtual machines, as a percentage value.
|
| High Memory Usage gauge | The threshold for the metric average_mem_usage_percent drives this gauge. This is the average of the amount of memory the virtual machine uses, as a percentage value.
|
| High CPU Sum Ready Time gauge | The threshold for the metric summation_cpu_ready_millisecond drives this gauge. This metric is measured in milliseconds and is a measure of how long a virtual machine has been waiting for processing time from the host.
|
| Total VMs counter | This is a count of the total number of virtual machines in your environment. Click on the number for Total VMs to see more details about each of the virtual machines in your environment, including the host system that the machine is on, and the associated vCenter. |
| Total VM Migrations counter | This is the total number of virtual machines that migrated. Click on the number for Total VM Migrations get more details about the virtual machines that migrated in the last four hours. To see the virtual machines that migrated the most, re-order this list by "TotalMigrations". |
Host System Health panel
The Host System Health panel includes the following components:
| Component name | Description |
|---|---|
| High Memory Ballooning | The threshold for the metric average_mem_vmmemctl_kiloBytes drives this gauge. This is the sum of all values from VMware's ballooning driver for all powered-on virtual machines. The host memory must be large enough to support the active memory of all virtual machines on the host. This number should be 0. Balloon drivers activate when memory is scarce.
|
| High Memory Swapping | The threshold for the metric average_mem_llSwapUsed_kiloBytes drives this gauge. This is the amount of memory from all virtual machines that has been swapped by the host. When this threshold is triggered, the host has no memory, and cannot reclaim memory from the ballooning driver. This number should be 0.
|
| High CPU Usage | The threshold for the metric average_cpu_usage_percent drives this gauge. This is the average CPU usage of the host systems, as a percent value.
|
| Total Hosts | This is a count of the total number of hosts in your environment. Click on the value displayed for Total Hosts to see more details about each individual host. |
The following metrics populate the gauges on the Host System Health dashboard panel:
| Gauge name | Indexed field | Entity type | Metric in threshold.conf file | Default threshold values |
|---|---|---|---|---|
| High Memory Ballooning | vsphere.esxihost.mem.vmmemctl | Host Systems | p_average_mem_vmmemctl_kiloBytes | critical = 10 warning = 2 |
| PercentHighSwapHosts | critical = 75 warning = 50 | |||
| High Memory Swapping | vsphere.esxihost.mem.llSwapUsed | Host Systems | p_average_mem_llSwapUsed_kiloBytes | critical = 5000 warning = 0 |
| PercentHighBalloonHosts | critical = 75 warning = 50 | |||
| High CPU Usage | vsphere.esxihost.cpu.usage | Host Systems | p_average_cpu_usage_percent | critical = 90 warning = 75 |
| PercentHighCPUHosts | critical = 75 warning = 50 |
To change the default threshold value for these metrics, perform the following steps:
- Stop the Splunk platform server on the search head.
- Open or create a local copy of the sa_threshold.conf file in $SPLUNK_HOME/etc/apps/DA-ITSI-CP-vmware-dashboards/local on Unix-based systems or %SPLUNK_HOME%\etc\apps\DA-ITSI-CP-vmware-dashboards\local on Windows systems.
- Change the critical/warning threshold value for selected metric and entity type(VirtualMachine/HostSystem/Datastore).
- Start the Splunk platform server on the search head.
Datastore Information panel
Use the Datastore Information panel to access information on all of the datastores in your environment. The data is measured in Megabytes (MB) and is not a percentage value. The indicator shows the amount of free space and the amount of storage committed.
Use the dashboard to assess if a datastore is close to capacity and in a critical state. Datastores can be in critical, warning, or normal operational states. If the app cannot gather sufficient information about a datastore then the datastore is represented in gray, indicating that the data for the datastore is unavailable or that the entity is not powered on.
The following metrics populates the Datastore Information dashboard panel:
| Entity type | Metric in threshold.conf file | Default threshold values |
|---|---|---|
| Datastore | RemainingCapacity_GB | critical = 50 warning=100 |
To change the default threshold value for this metrics, perform the following steps:
- Stop the Splunk platform server on the search head.
- Open or create a local copy of the sa_threshold.conf file in $SPLUNK_HOME/etc/apps/DA-ITSI-CP-vmware-dashboards/local on Unix-based systems or %SPLUNK_HOME%\etc\apps\DA-ITSI-CP-vmware-dashboards\local on Windows systems.
- Change the critical/warning threshold value for selected metric and entity type (VirtualMachine/HostSystem/Datastore).
- Start the Splunk platform server on the search head.
Recent VMware Alarms panel
Use the Recent VMware Alarms panel to see events that occurred in your environment that triggered alarms. Alarms can be triggered for a number of reasons including memory usage reaching a critical level for a virtual machine, or CPU usage for a host reaching a critical level.
For example, click on an alarm for "virtual machine memory usage" to see the event that triggered it. The Virtual Machine detail page is displayed. You can now see details about the event that triggered the alarm.
The source type vmware_inframon:events drives the data that is displayed in this panel.
Host System Detail dashboard
Use the Host System Detail dashboard to see the details for a specific host system over the time range selected.
Use the dashboard to perform the following tasks:
- Get a quick view of the state of your host system.
- Identify the root cause of issues on the host.
- Check how the host performs against key performance metrics.
This dashboard is accessible from the main Dashboards menu, and also through the Proactive Monitoring dashboard. From the Proactive Monitoring dashboard, choose Host System in the Entity field.
The dashboard includes the following dashboard panels that populate after you select a VirtualCenter, HostSystem, and date or time-range from the fields at the top of the dashboard:
- Host Configuration and Status
- Connected Datastores
- Virtual Machine Information
- Recent Tasks and Events
- Recent ESXi Log Entries
- Chart of performance data for a host
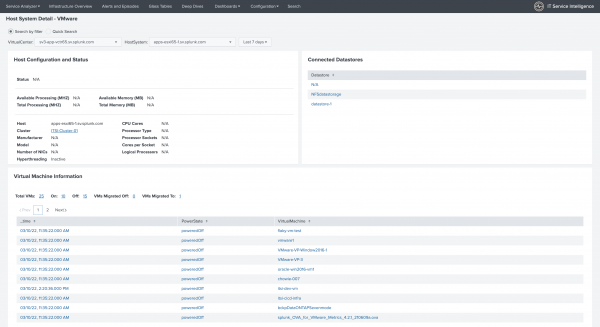
The following image shows the Host System Detail dashboard with example data:
Host Configuration and Status panel
The Host Configuration and Status panel shows basic configuration information about the state of the specific host. On this panel you can see the following information:
- Status of the host.
- Available and total processing power (in MHZ) for the host.
- Available and total memory (in MB) for the host.
- Name of the host. This is the same name that is displayed in the search bar on the dashboard.
- Cluster to which the host belongs, if it is configured as part of a cluster.
- Specific manufacturer and model number for the host.
- Hyperthreading status, active or none.
- Resource details of the host including the number of NICs, the number of CPU cores assigned to the host, processor information, and socket information, in addition to the memory and processing allocations.
Connected Datastores panel
The Connected Datastores panel shows a list of datastores connected to the host. Click the datastore name to drill down to the specific details for that datastore, shown on the Datastore Detail dashboard. Get visibility into the file types residing on that datastore and use this information to plan your storage requirements for the host.
Virtual Machine Information panel
The Virtual Machine Information panel displays high level information about the virtual machines that reside on this host. On this panel you can see the following information:
- Total number of virtual machines on the host.
- Total number of virtual machines powered on and off.
- Number of virtual machined that migrated off this host.
- Number of virtual machined that migrated on to this host.
Select the value associated with each of the fields to see specific details for that field. For example, click 23 for Total VMs to display a table with details for all the virtual machines on the host.
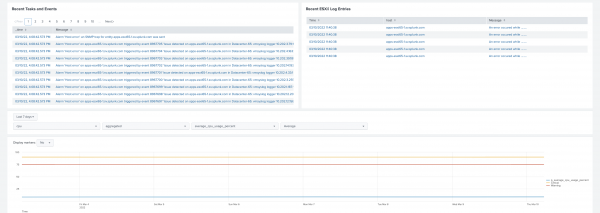
Recent Tasks and Events panel
The Recent Tasks and Events panel shows recent tasks associated with the host, and events that have occurred on the host. This panel lists all completed tasks on the host. The task list includes tasks performed on the virtual machines on the host. You can also see alarms that activate if there was a change status for a resource.
You can use this information to investigate the root cause of problems on your host. You can also check if the host is resourced correctly.
The following image shows the Recent Tasks and Events panel with example data:
Recent ESXi Log Entries panel
The Recent ESXi Log Entries panel provides a quick look at log files generated by VMware ESXi hosts. ESXi host logs are written to the file system and provide information about system operational events.You can examine the log files in detail by drilling down to system events that can identify particular issues in your environment.
Chart of performance data for a host panel
The chart of performance data panel shows the host system at a very detailed level. The chart shows the performance of the host for a specific performance data type, mapped against the critical and warning threshold selected for the metric. The chart is driven by performance metrics for the host.
Use the available fields on the panel to filter the data to be chartted. Select from the following fields on the panel:
| Field name | Description |
|---|---|
| Performance type | Choose the type of performance data you want to measure from the drop-down menu |
| Instance data | When instance level data collection is turned on, performance data is collected as specific instances of performance counters. If instance level data is turned on, this drop-down list is populated with an identifier or a number of identifiers derived from configuration information. If instance level data is not from your environment, then the drop-down list defaults to aggregated (aggregated data for all of the instances). |
| Performance metric | The performance metric to measure. |
| Statistical operation | Choose a statistical operation on the data to determine the chart results. |
The resulting chart displays the critical and warning threshold levels set for the selected metric. The performance of the host in relation to this metric is charted. You can look for spikes on the chart and investigate the causes.
Performance of Hosts and VMs dashboard
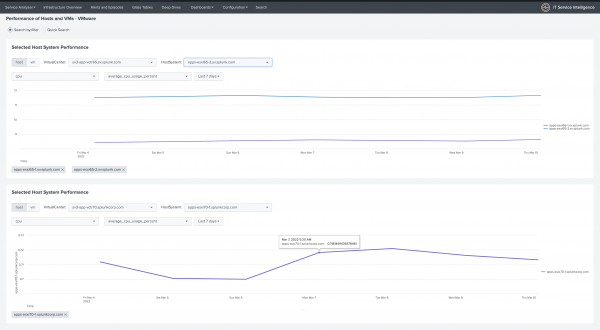
Use the Performance of Hosts and VMs dashboard to visually compare the performance statistics, for hosts and virtual machines, in your VMware vSphere® environment, based on a selected performance metric.
You can compare the performance statistics of the following hosts and machines::
- A host on one VMware vCenter Server with another host on the same vCenter Server.
- Multiple hosts in a vCenter Server with hosts on another vCenter Server.
- One or more virtual machines with other virtual machines.
The Performance of Hosts and VMs dashboard shown here displays average CPU usage for a host as a percentage over the course of seven days.
Performance of Hosts and VMs dashboard panels
On each of the dashboard panels, use the toggle buttons, the search box, and the drop-down lists to set your search criteria. The name of the selected host or virtual machine is displayed in the panel, and a chart shows the performance statistics for that host or virtual machine.
You can chart a maximum of 50 hosts or virtual machines and compare the performance statistics for each. To change the default limit, edit the value set for limitSelectionCount in the SOLNSelector module in the host_vm_perf view: name="limitSelectionCount">50
To clear the chart, click on each of the listed entity names in the panel to remove them.
The following panel fields are available:
| Field name | Description |
|---|---|
| host / vm toggle | Use this toggle to select either host or vm.
|
| Search box |
|
| Drop-down lists |
|
Proactive Monitoring dashboard
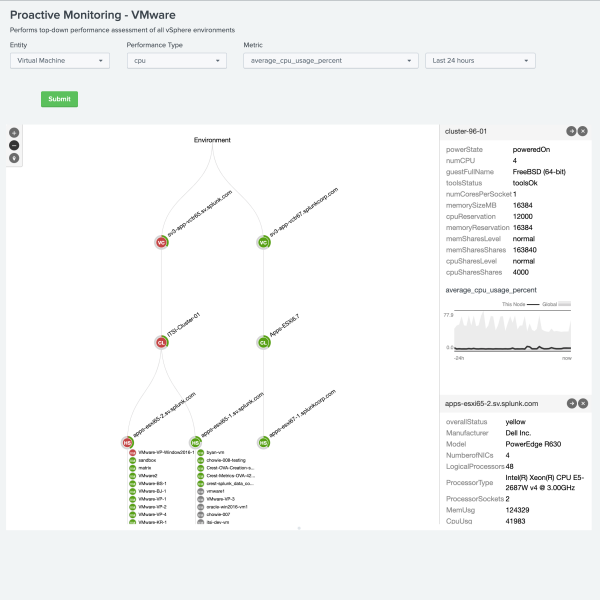
Use the Proactive Monitoring dashboard to troubleshoot your environment and to identify problems in your infrastructure. You can assess how different entities in your environment perform for different performance metrics. Use this data to directly manage any performance concerns in your IT environment (at scale) and prevent bottlenecks and outages in other areas of the enterprise.
From the top of the dashboard, select an Entity, Performance Type, Metric, and date or time-range to populate the dashboard panel. Gain insights using a topology tree, and compare those insights using entity pins.
Topology tree
Once you select an Entity, Performance Type, Metric, and date or time-range, a topology tree is built using topology information from vCenter. The topology tree provides insight to the overall state of your virtual environment. The tree is sorted based on the count of critical entities in your environment, with the most critical entities shown on the left of the tree.
Using the topology tree you can perform the following tasks:
- Change how you view the topology tree. Choose to display the topology from the host system or the virtual machine perspective.
- Change the performance metric type displayed. The tree is redrawn to display your environment for the new metric.
- Navigate around your environment expanding and reducing the view of your environment.
- Drill down to the entity level to get a more detailed view of that entity.
- Compare how entities perform for different metrics.
Each node in the tree represents an entity in your environment. Environments, virtual centers, clusters, and hosts stack horizontally in the tree. Virtual machines are displayed in a vertical stacks underneath their parent host node, to the right of the anchor point. Each of the entities are sorted criticality by the color red, yellow, or green.
The data displayed in the topology map is performance metrics, based on the data that the app collects and uses to monitor the performance of your environment. In the Content Pack for VMware Dashboards and Reports, the performance metric name (for example, average_cpu_usage) and the value used to measure it (percent) are connected as shown by the display name for the metric (average_cpu_usage_percent).
The severity levels displayed by each node are driven by the thresholds set for the metrics selected. You can change a metric for the displayed entities, or change the entity, and the tree updates and repopulates within seconds with the latest information.
You can select how you want to view your environment. You can view the topology map down to the host system level or get a complete view down to the virtual machine level. The ability to pan across the topology map or zoom in to specific entities provides visibility into your environment.
The color coding of the nodes on the topology tree provides a bottom up indication of the status of your environment. Nodes are colored red, yellow, or green indicating the level of criticality in the entity or in the child entities. This color coding gives you a quick status of the node. You can get more details when you hover over a node to display the associated tooltip.
You can compare the entities for selected metrics when you pin them on the pinboard. You can drill down on nodes in the topology tree to more detailed views of specific entities to find the root cause of problems in your environment.
To create a topology map using the drop-down lists, perform the following steps:
- Select an entity type from the Entity drop-down: Virtual Machine or Host System.
- Select a Performance Type. This is the type of performance data (such as cpu, mem, or disk) upon which to base the performance measurement of your environment.
- Select a Metric. Each performance data type has a set of metrics associated with it.
- Select a time range over which you want to run the search.
- Click Submit to create the topology map.
The topology tree populates only if you have set values in the drop-down lists on the dashboard. These values power the searches that generate the topology map.
The topology tree doesn't function in real-time.
Nodes
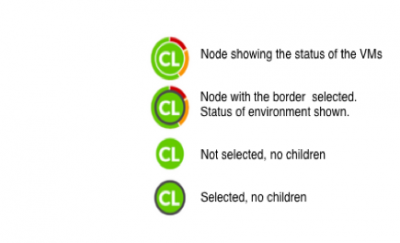
A node represents a single entity in your VMware vSphere hierarchy. It contains references to its parents and children, threshold status, name, and identifiers. Nodes are used to show the overall state of the entity they represent (cluster, host, virtual machine) and are color coded to provide a quick view of the state of your environment. The nodes display green, yellow, or red depending on the state of the environment. Nodes at the virtual machine level are organized by criticality. Virtual machines that are in the most critical state appear higher in the hierarchy, while those in a healthier state appear lower on the hierarchy.
Nodes have a status associated with them. All leaf nodes show a single color, which is the status for that node, while parent nodes display a color indicating the highest level of criticality for the nodes in the environment below it. Parent nodes also display node status indicators. You can perform the following tasks using nodes:
- Hover on a node to display the tooltip for the node.
- Click on a node to expand it and display the child nodes.
- Pin a node to the dashboard so that you can compare the details of that node with other nodes.
The node status indicator is a doughnut indicator that encompasses a node. Only parent nodes display this indicator. The status indicator provides a quick view into the status of your environment. The absence of an indicator indicates that the node doesn't have children and doesn't expand further. The node status indicator can be divided into three segments to show the state of the selected performance metric for the entities in the environment. A metric for an entity can be in one of four states - normal, warning, critical, or unknown/offline. Each segment of the three segment chart around the node indicates the portion of children nodes in each of the three status states (red, yellow, green). The color of the node itself (the color in the center) indicates the status of the largest group of entities in your environment.
Tooltips
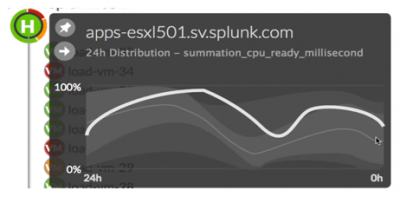
A tooltip is displayed when you hover on a node in the topology map. Tooltips are displayed for specific entities including virtual machines, hosts, and clusters in your environment. Tooltips display data for that entity, the complete environment, and a branch of the hierarchy.
Using the tooltip you can perform the following tasks:
- See the state of the metric measured for the selected entity over time.
- Pin the entity. This enables you to compare it using the pinboard to other entities in your environment.
- Drill down to get detailed information on the entity.
For example, if you hover over a virtual machine, the tooltip displays the following information:
- The name of the virtual machine.
- The the time range over which the data is mapped.
- The metric used to measure the performance of the particular virtual machine.
- A distribution stream chart that maps performance data distribution over time for a selected metric.
- The white line on the tooltip represents the performance of the virtual machine or the average of all nodes in the branch mapped for the specific metric selected, over the specific time range.
- The light grey line represents the global median.
- The light grey zone displays results within 1 standard deviation of the global median.
- The dark grey zone displays results within 2 standard deviations of the global median.
Host information is displayed in the tooltip when host is selected.
Pin an entity
In the Content Pack for VMware Dashboards and Reports, you can organize and compare various parts of your environment for different performance metrics and different entities. You can compare data for different entities in your environment in the Proactive Monitoring dashboard.
The pinboard in the Proactive Monitoring dashboard is used to store pinned entities in your environment. A pinned entity is one that you selected in the topology tree to save to the pinboard so that you can compare it with other entities. Pinned entities stay on the dashboard even when you change the entity and metric used to monitor the behavior of your environment. You can drill down on the entities within a pinned entity.
The pinboard is a collection of detailed views. When a parent node is pinned, detail information for it and the child entities is displayed in the detail pinned panel. When a leaf node is pinned, a detail pinned panel is displayed showing information only for that entity.
The data displayed for pinned entities is not affected by changing the time range on the page. Pinned entities are not preserved upon reloading a page. Once a page reloads you must pin entities once again. You can delete the entity or minimize it. All other actions on the page have no effect.
To pin an entity perform the following steps:
- Hover over a node to display the tooltip for that node.
- Click the pin in the tooltip.
- The entity is now pinned on the pinboard and the detail pinned panel is displayed for the particular entity.
Different information is displayed on the pinned panel, depening on the pinned entity. Use the following table to see what is displayed by entity:
| Entity on pinned panel | Information displayed |
|---|---|
| Virtual Center detail | Title bar showing the name of the virtual center and a link to navigate to the virtual center details page (arrow). Total number of hosts managed by the virtual center. |
| Cluster | Title bar showing the name of the cluster and a link to navigate to the cluster details page (arrow).
|
| Host | Title bar showing the host name and a link to navigate to the host details page (arrow). Overall status of the host (green, yellow, red). |
| Virtual Machine | Title bar showing the virtual machine name and a link to navigate to the virtual machine details page (arrow). Power state if the virtual machine is powered on. |
Task and Event Details dashboard
Use the Task and Event details dashboard to quickly review tasks and events that occurred on the various entities in your environment.
The source types vmware_inframon:events or vmware_inframon:tasks must be present for this dashboard to work correctly.
Use the drop-down fields at the top of dashboard to narrow the results on the dashboard panel. The following fields are available:
| Field name | Description |
|---|---|
| Time range | .The time range over which events are reported. |
| Event Classification | List of all events that you can review. The default value is All. |
| Virtual Center | Enter the name of a vCenter server. |
| Datacenter | Enter the name of a data center. |
| Cluster | Enter the name of a cluster. |
| Host | Enter the name of a host. |
| Virtual machine | Enter the name of a virtual machine. |
| Username | Enter the name of a user. |
| Task | Enter a specific task. |
| Message | Enter a specific message relevant to a task or event. |
vCenter Log Browser dashboard
Use the vCenter Log Browser dashboard as a simple interface to view virtual center server logs.
Your vclog data must be set up to forward to the Content Pack for VMware Dashboards and Reports for this dashboard to work correctly. For detailed steps, see Configure Splunk Add-on for VMware Metrics to collect vCenter Server log data in the Splunk Add-on for VMWare Metrics manual.
The following log data is available on this dashboard:
- Main vCenter diagnostic logs (vpxd).
- Storage management service logs (sms logs).
- vCenter web services logs (vws/tomcat/stat/cim-diag).
The following source types must be present for data to populate the dashboard panels:
- vpxd: vmware:vclog:vpxd
- sms: vmware:vclog:sms
- vws/tomcat/stat/cim-diag: vmware:vclog:vws or vmware:vclog:stats or vmware:vclog:cim-diag or vmware:vclog:vim-tomcat-shared or vmware:vclog:tomcat
Use the drop-down fields at the top of the dashboard to narrow results on the dashboard panel. The following fields are available:
| Field name | Description |
|---|---|
| Time range | The time range over which events are reported. |
| vCenter | List of vCenter servers from which you are collecting syslog data. The default value is All. |
| Look For | Enter the term that you want to specifically search for in the logs. |
| Level | The logging level. This can be DEBUG, INFO, WARN, ERROR, or FATAL. The default is ERROR. |
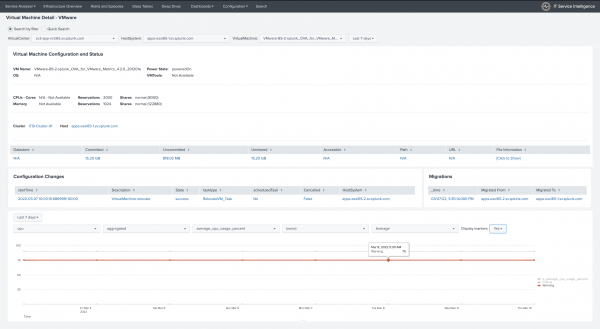
Virtual Machine Detail dashboard
Use the Virtual Machine Detail dashboard to view the details for a specific virtual machine. Using this dashboard you can perform the following tasks:
- Track virtual machines in your environment as they migrate across hosts.
- Identify the root cause of virtual machine issues.
- Check how the virtual machine performs against key performance metrics.
- Gain insight into the granular virtualization layer data, which can help identify problems faster.
The dashboard consists of the following four dashboard panels:
- Virtual Machine Configuration and Status
- Configuration Changes
- Migrations
- Chart of performance data for the virtual machine
The information displayed in each of the panels in the dashboard is determined by the selection you make in the fields at the top of the dashboard. Choose a VirtualCenter, HostSystem, VirtualMachine, and a date or time range to populate the dashboard panels.
The following is an image of the Virtual Machine Detail dashboard populated with example data:
Virtual Machine Configuration and Status panel
This panel provides basic configuration information about the state of your virtual machine. The panel includes the following information:
- The name of the virtual machine.
- The operating system is installed on the virtual machine.
- The state of the virtual machine, whether it is powered on or off.
- A status for VMTools, if VMTools is installed on the virtual machine.
- The resource details of the virtual machine. These resources include the following:
- The number of vCPUs (cores) assigned to the virtual machine, the memory allocation as well as the reservations and shares for each of these resources.
- The cluster and the host to which it belongs. Drill down on the cluster or the host information to get to the detailed dashboards for the selected entity.
- High-level details about the datastore connected to the virtual machine and how much space the virtual machine is taking up on the datastore.
Configuration Changes panel
This panel shows all of the configuration changes for the virtual machine. You can use the information on this panel to investigate the root cause of problems. For example, If a virtual machine goes down you can check if a scheduled task or an unscheduled task was the cause of the outage. You can also check resource allocations, such as how CPU or memory resources changed for the virtual machine.
Migrations panel
This panel shows all of the migrations for the specific virtual machine. If the virtual machine migrated from one host to another over a period of time, the list of hosts is displayed. You can use the chart in the last panel to split migrations across hosts to get more detailed information.
Chart of performance data for a virtual machine panel
In this panel you can look at the virtual machine at a very detailed level. Use this panel to perform the following tasks:
- Control the charting of performance data for a specific virtual machine.
- Show the performance of the virtual machine as it migrated across hosts.
- See when the virtual machine was last on a host.
The chart shows the performance of the virtual machine for a metric of a specific performance data type, optionally split by host, mapped against the critical and warning threshold for the metric selected. The chart is driven by performance metrics for the virtual machine.
Use the drop-down lists to filter your selections for charting the data. Select from the following field options:
- Performance type: This is the type of performance data you want to measure for the virtual machine.
- Instance data: If instance level data is turned on, this drop-down list is populated with values representing instances. If instance level data is not being collected from your environment, then the menu defaults to aggregated (aggregated data for all of the instances).
- Performance metric to measure.
- Statistical operation on the data.
Filter and split by host
You can correlate the data with migration information for the virtual machine. Use the split by drop-down menu to correlate the data by the physical host of the virtual machine. You can see a history of where the virtual machine has been over a period of time. You can also see when the virtual machine was last on a host.
To filter the data and split by host, perform the following steps:
- Select a performance type from the split by drop-down menu.
- Select a value for instance data from the options available, if you have instance level data turned on, or select aggregated.
- Select a metric for the performance type.
- Select none or host. Selecting host charts the data and splits it by host. If the virtual machine migrated, all of the hosts on which it resided are displayed in the chart. Splitting by host shows a history of what host it was on and when. Keep the value at none if you do not want to split the results
- Select how you want to view the data on the chart.
The resulting chart shows the critical and warning threshold levels set for the selected metric. The performance of the virtual machine in relation to this metric is charted. If the virtual machine migrated from one host to another, then the results are split across the hosts. Look for spikes on the chart and investigate their cause.
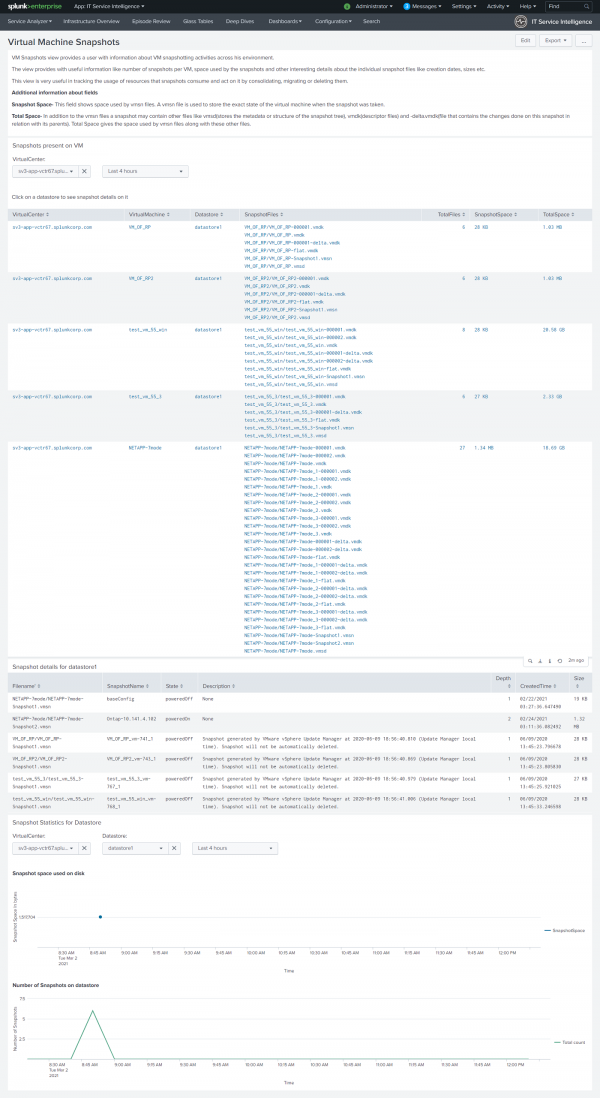
Virtual Machine Snapshots dashboard
Use the Virtual Machine Snapshots dashboard to get information about snapshotting activities for virtual machines in your environment. Choose to take action on the data by consolidating, migrating, or deleting the snapshots.
On the Virtual Machine Snapshots dashboard, you can perform the following tasks:
- See the number of snapshots per virtual machine.
- See the space used by the snapshots.
- Track the usage of resources that snapshots consume.
- Look at individual details about snapshot files such as file creation dates, and file sizes.
Virtual Machine Snapshots dashboard panels
The information displayed in each of the panels in the dashboard is determined by the selection you make in the drop-down lists at the top of each dashboard panel. On this dashboard, resources consumed by the datastore are tracked. Information on this dashboard can help determine if snapshot behavior has an impact on your overall environment.
The following columns appear on the Snapshots present on VM dashboard panel once you select a VirtualCenter and date or date range to populate the panel:
| Column name | Description |
|---|---|
| VirtualCentre | Name of the virtual center. |
| VirtualMachine | Name of the virtual machine. |
| Datastore | Name of the datastore. Click on the datastore to drill down and see the snapshot details for it. |
| SnapshotFiles | The names of the files in the snapshot. |
| TotalFiles | The total number of snapshot files. |
| SnapshotSpace | The space used by vmsn (VMware snapshot) files. A vmsn file is used to store the exact state of the virtual machine when the snapshot was taken. |
| TotalSpace | A snapshot contains vmsn files along with other files. TotalSpace is the space used by vmsn files in addition to the space used by the following files:
|
The following fields appear on the Snapshot Statistics for Datastore panel once you select a VirtualCenter, Datastore, and date or date range to populate the panel:
| Panel name | Description |
|---|---|
| Snapshot space used on disk | Chart that displays the snapshot space (in bytes) used on the disk over the time range selected. |
| Number of Snapshots on datastore | Chart that displays a count of the number of snapshots on the data store over the selected time range. |
| Troubleshoot the Content Pack for VMware Dashboards and Reports | Reports reference for Content Pack for the VMware Dashboards and Reports |
This documentation applies to the following versions of Content Pack for VMware Dashboards and Reports: 1.3.0, 1.3.1, 1.4.0

 Download manual
Feedback submitted, thanks!