Correlation searches
Notable events can be configured by modifying their associated correlation searches. Correlation searches generate notable events, which are shown in the different views and dashboards of Splunk for Enterprise Security. To inspect or change a correlation search (to modify a notable event), click Correlation Searches in the Configuration panel (Configure > Incident Handling > Correlation Searches).

Click on Correlation Searches to view the list of currently available correlation searches.

The Splunk App for Enterprise Security comes with 50 pre-configured correlation searches.

To edit an existing correlation search, click the correlation search name in the list and use the Correlation Search editor to modify the search. Click New to create a new correlation search using the Correlation Search editor.
Enable and disable correlation searches
In the Correlation Searches panel you can enable or disable searches individually in two ways. Select Configure > Correlation Searches to see a list of all correlation searches.
Click Status
1. Find the name of the correlation search to disable. Do not click the name.
2. Click Disable under the Status column.
Click check box
You can also disable a correlation search using the check box:
1. Click the check box next to the correlation search name.
2. Click Disable at the bottom of the panel.
Enable a single search
To enable a single correlation search:
1. Click the check box next to the correlation search name.
2. Click Enable at the bottom of the panel.
Batch enable or disable of real-time searches
To view only the real-time searches in your deployment, click "Show only real-time searches" at the top of the panel. The current real-time searches are displayed.
To disable a group of real-time correlation searches:
1. Click "Show only real-time searches".
2. Click "Select all" at the bottom of the panel.
3. Click Disable.
You can also manually check individual boxes and click Disable to disable all of them.
To enable a group of real-time correlation searches:
1. Click "Show only real-time searches".
2. Click "Select all" at the bottom of the panel.
3. Click Enable.
You can also manually check individual boxes and click Enable to enable all of them.
See "Convert real-time searches to scheduled searches" for more information about real-time searches.
Correlation Search editor
The Correlation Search editor is used to create or modify correlation searches used by the Splunk App for Enterprise Security. Options for configuration include:
- Edit correlation search thresholds
- Edit correlation search severity
- Set up correlation search governance
- Disable correlation searches: If you are not interested in a particular group of notable events, you can disable their correlation searches.
For example, if you are not bringing in any malware data, disable the malware-related correlation searches. Disabling correlation searches will reduce resource utilization of Splunk. - Edit correlation searches
- Filter notable events
- Create correlation searches
Warning: When adding indexes to the default search indexes do not include any summary indexes, as this can cause a search and summary index loop. See the Enterprise Security User Guide FAQ for more details.


This table describes the fields that can be modified in the Correlation Search editor.
| Field | Description |
|---|---|
| Correlation Search Name | Name of the correlation search |
| Domain | Domain that the correlation search is part of |
| Application Context | This field displays the folder where the correlation search will be stored on the Search Head (for example, SA-AccessProtection) |
| Correlation Search Description (optional) | What the search does |
| Search | Raw search string associated with this correlation search |
| Time range (optional) | Start time and Finish time |
| Search Type | Cron schedule |
| Attributes | |
| Rule Title | This will be displayed in the top line of each notable event in the Incident Review panel. Variables can be included to quickly identify different but similar events. |
| Rule Description | This will be displayed in the expanded notable event, and is used to provide additional context. Variables can be included here, as well as an explanation of the correlation search logic and/or guidance for incident responders. |
| Severity | informational, low, medium, high, critical |
| Default Status | You may choose to override the status for newly created notable events here. |
| Default Owner | You may choose to automatically assign newly created notable events to a specific analyst here. |
| Drill-down Name | This string will be used to label the drill-down search used to find raw events related to this notable event. Variables may be used to explain the search. |
| Drill-down Search | This search string will be used in a new search to find raw events related to the notable event. Variables may be used to target the search. |
| Alert Actions | Send email, Add to RSS, Run a script, Tracking |
| Throttling | Duration of throttling of events |
| Fields to Group by | If these fields contain the same values as previously generated notable events within the throttle duration, the correlation search will not produce a new notable event. |
Throttling window duration
To set a window duration during which matching events will not fire, go to Configuration > Correlation Searches > $search > Throttling. Set the time span in the Window Duration field.
For instance, say there is a scheduled search with an overlapping window (runs every 5 minutes and looks at a 10 minute window). If this search detects a simple condition in an event, it will re-detect that same event and generate a second notable event unless throttling is set.
Throttling fields to group by
Set a collection of fields to group by to determine if the same event is being detected. Go to Configuration > Correlation Searches > $search > Throttling. Add the field names in Fields to group by.
For instance, say there is a more complex search that looks at 10 raw events to determine if there is a notable event. The field names entered in this field must match before a second notable event is generated.
Notable events
A notable event may be associated with one or many raw events. The drill-down search feature of the Correlation Search editor allows an administrator to define the search used to follow this association, as well as the textual link that will be presented to Security Analysts reviewing notable events under the Contributing Events heading.
There are two fields in a correlation search to consider for notable events. The Drill-down Name field is used to define the textual link that will be presented to Security Analysts reviewing notable events. Tags may be used to provide expandable context, such as host names and addresses. For instance, in the High Or Critical Priority Host With Malware Detected correlation search this field is set to "View infections on $dest$".
The '"Drill-down Search'" field is used to define the search that will be used to find associated raw events. For instance, in the same correlation search this field is set to tag=malware tag=attack dest=$dest$. Security Analysts viewing a notable event generated by this correlation search in relation to a destination 192.168.1.1 will see a Contributing Events link "View infections on 192.168.1.1".
Schedule real-time searches
The Splunk App for Enterprise Security introduces the ability to use real-time correlation searches. A number of real-time searches are shipped with the Splunk App for Enterprise Security. See the "Specify real-time windows in your search" topic in the core Splunk product documentation for more information.
Note: The Search type > Cron Schedule field will be automatically filled in. When using a real-time search, this field controls how often the Splunk search scheduler confirms that the search is still running.
Convert real-time searches to scheduled searches
In your deployment, you may want to convert some of your real-time searches to scheduled searches. There are two ways to do this; from the Correlation Search editor or from the Correlation Searches list.
To convert searches from the Correlation Searches list:
1. Navigate to Configure > Correlation Searches and find the real-time search you want to convert.
2. Find the real-time search to convert to a scheduled search.
3. Click "Change to scheduled".
To convert searches from the Correlation Search editor:
1. Navigate to Configure > Correlation Searches and find the real-time search you want to convert.
2. Click the search name to open the Correlation Search editor.

3. In the Time range fields, remove the "rt" from in front of the Start time and the Finish time.
4. Save the search
Using either method, the correlation search will now run as a scheduled search.
Note: Some of the the built-in scheduled searches cannot be converted to real-time because they are based on indexes that are not built in real-time.
Understand correlation search thresholds
Correlation searches use thresholds to set the number of security events of a specified type that must occur to trigger a notable event. You can configure the thresholds for these searches based on the typical number of events in your environment. For example, the Outbreak correlation search triggers when the number of new infections within the last 24 hours exceeds the threshold, alerting you when an organization-wide issue is developing. However, the Outbreak correlation search needs to be adjusted to reflect the size and load of your environment. A large enterprise may consider 10 new infections within a 24-hour period an outbreak, whereas a small company may consider only 3 new infections an outbreak. The threshold sets the number of infections that that correlation search considers noteworthy.
Threshold settings are best configured after developing a baseline of security events. Splunk recommends indexing two weeks of data before finalizing the baseline settings. Additionally, thresholds need to be adjusted over time as the network changes.
See "Correlation Search Thresholds" in the Splunk for Enterprise Security User Manual for more detail on setting thresholds.
Configure correlation search thresholds
Some security problems can be detected based in part on the volume of events. For example, a few new infections on a large network may be considered normal. However, a large number of new infections may indicate the presence of a deeper problem such as an outbreak. Correlation searches for these types of security problems generate notable events when certain security indicators exceed a given value.
Edit correlation search thresholds
Correlation searches are implemented using saved searches in Splunk. To change a correlation search threshold, you need to edit the associated saved search.
To do this:
1. Select Configure > Correlation Searches to see a list of all correlation searches.
2. Click the name of the correlation search to modify.
3. Locate the threshold for the correlation search. Usually this will have a greater than (>) sign and a number.

4. Adjust the number to the value you have determined is correct for your environment.
5. Click Save at the bottom of the page.
Configure the watchlisted event correlation search
To use the watchlisted event correlation search a set of watchlisted events needs to be defined. A watchlisted event in the Splunk App for Enterprise Security is defined as any event which has the tag "watchlist".
These watchlist events are included with the Splunk App for Enterprise Security:
| Name | Watchlist |
|---|---|
| TA-sav | [eventtype=sav_hacktool]
[eventtype=sav_wineventlog_hacktool] [eventtype=sav_keylogger] [eventtype=sav_wineventlog_keylogger] [eventtype=sav_rootkit] [eventtype=sav_wineventlog_rootkit] |
| SA-IdentityManagement | (via identity lookup)
[src_user_watchlist=true] [user_watchlist=true] (via asset lookup) [host_owner_watchlist=true] [orig_host_owner_watchlist=true] [src_owner_watchlist=true] [dest_owner_watchlist=true] [dvc_owner_watchlist=true] |
| SA-ThreatIntelligence | By default the Splunk App for Enterprise Security does not ship with any watchlisted events enabled for SA-ThreatIntelligence. For this reason the "watchlist" tag has been disabled. To enable the watchlist feature, do the following from the Settings menu: 1. Enable the tag "watchlist" in the SA-ThreatIntelligence app. 2. Add a valid search string to the eventtype "watchlist" in the SA-ThreatIntelligence app. |
| Splunk_TA_windows | [eventtype=windows_audit_log_stopped]
[eventtype=windows_audit_log_cleared] |
| TA-sep | [eventtype=sep_risk_hacktool] |
| TA-mcafee | [eventtype=mcafee_watchlist_gambling] |
To add events to the watchlist, simply tag any field value in the event with the tag "watchlist". This tag can be created in the same manner as any other tag.
For more information on creating tags, see "Tag and alias field values in Splunk Web" in the core Splunk product documentation. Also see "How can I set up a watchlist" on Splunk Answers.
Keep in mind that it is best to select as specific a field value as possible when tagging events as "watchlist", to prevent this correlation search from matching too many events.
Note: This behavior was changed from Enterprise Security Suite 1.1.2 to Splunk for Enterprise Security 2.2.
Identity correlation correlation search
There is a correlation search that generates notable events when accounts that should be disabled are active. An identity correlation endDate field will cause notable events if access is detected after that date. Go to Access Protection > Access Tracker. The notable events associated with expired account usage appear in the Account Usage for Expired Identities panel at the bottom of the dashboard.
![]()
Click on a user to find out more about the systems involved. Click View full results to drill-down to the raw event information.
![]()
The correlation search associated with this panel is "Identity - Activity from Expired User Identity - Rule".
Configure correlation search governance
You can add governance or a control number to your correlation search. The governance information is automatically generated and stored in the governance.conf file.
Add governance to a correlation search
1. To add a governance and control number to a specific correlation search, determine the exact name of the saved search and what supporting add-on or domain add-on contains the search.
To get this information, find the field titled "Search Name" in the notable event, or find the name in the list of correlation searches (Configure > Correlation Searches). Click on the search name. The "Application Context" field in the Correlation Search editor displays the supporting add-on (SA) or domain add-on (DA) that contains the search.
For example, the correlation search for locating insecure or cleartext authentication is:
Access - Excessive Failed Logins - Rule
and is in the SA-AccessProtection supporting add-on.
2. In the supporting add-on or domain add-on that contains the correlation search, use the following format to add governance to the $SPLUNK_HOME/etc/apps/<SA_or_DA>/local/governance.conf file.
3. Add a the information to the correlation search stanza in this format. The terms to edit are in bold:
compliance.<#>.<governance>_control = <governance_name>
compliance.<#>.control = #For example, to add governance for HIPAA 1.1 and SOX 3.6 to the correlation search
Access - Excessive Failed Logins - Rule, add the following stanza:
compliance.0.governance = hipaa
compliance.0.control = 1.1
compliance.1.governance = sox
compliance.1.control = 3.6
4. Updates to governance.conf require a splunkd restart, or a refresh of the governance endpoint to be enabled.
To refresh the governance.conf endpoint, browse to:
https://127.0.0.1:8000/en-US/debug/refresh?entity=alerts%2Fgovernance
or go to:
https://127.0.0.1:8089/services/alerts/governance/_reload
For more information on how to configure governance.conf, see governance.conf.spec and governance.conf.example in SA-ThreatIntelligence/README.
Configure correlation search severity
1. Select Configure > Correlation Searches to see a list of all current correlation searches that are generating notable events.
2. Click the name of the correlation search to configure. The Correlation Search editor opens.
3. In the Severity field of the editor, change the severity to the desired level. Allowed values are informational, low, medium, high, and critical.
Note: If a severity field exists in the result set, it will override this setting. If you override the severity field, be sure to normalize the values so that the severity value is informational, low, medium, high, or critical.
4. Click Save.
Alert actions for correlation search
Alert actions or notifications can be set up using the correlation search editor. When conditions specified as part of the correlation search occur, an alert action can be generated. Select one or more of these alert options in this section of the correlation search editor:
- generate an email
- send an RSS feed
- run a script
- turn on tracking
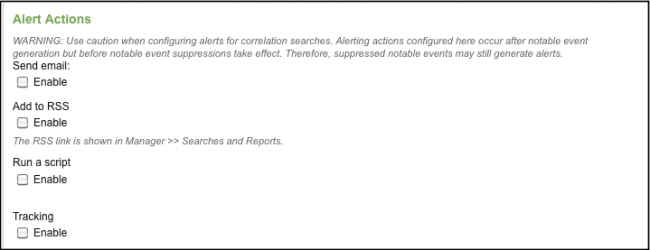

Note: Use caution when configuring alerts for notable events. Alerting actions configured here occur after the notable event generation, but before notable event suppressions take place. Because of this suppressed notable events may still generate alerts.
| Configure the search head | Modify correlation searches |
This documentation applies to the following versions of Splunk® Enterprise Security: 3.0, 3.0.1
Feedback submitted, thanks!