Solution architecture
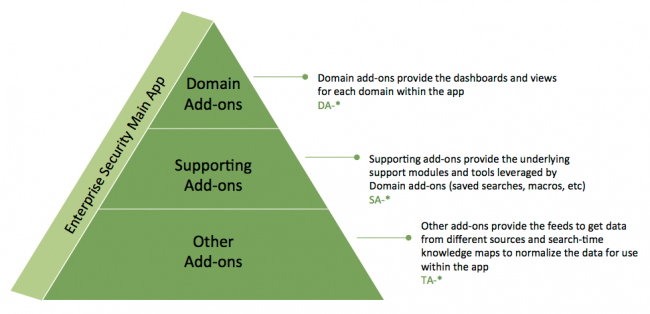
The Splunk App for Enterprise Security contains a main app, supporting domain add-ons, and other add-ons. These are packaged together as a single download. Splunk for Enterprise Security works to build and populate summary and investigative views of security-relevant data captured and stored within Splunk.
The following diagram shows the add-ons and their functions:
The Splunk App for Enterprise Security
The Splunk App for Enterprise Security provides high-level views and functionality that aggregate and correlate information across all domains. Many dashboards, searches, and views are available. The primary dashboards are described here.
- Security Posture dashboard
- The primary Splunk for Enterprise Security dashboard. It provides a high-level visual summary of the notable events across all the deployment in the past 24 hours. This dashboard updates in real time, in addition to trend indications against the previous 24 hours and also shows "billboard" listings of top rules, sources, and destinations.
- Incident Review dashboard
- Shows the details of all notable events identified within the deployment. From this dashboard you can monitor notable event activity, filter events by criteria such as urgency or domain, or manage the status of the notable events.
- Predictive Analytics dashboard
- Entity Investigation dashboard
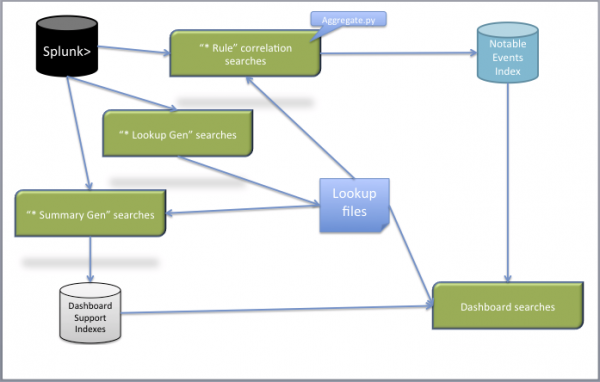
The dashboards in the Splunk App for Enterprise Security use notable events, which are aggregate events that identify patterns or security issues that might require investigation. These notable events are generated by real time and scheduled searches called "correlation searches." The Splunk App for Enterprise Security correlation searches must be configured to ensure that they run correctly in your environment.
Content appears in these dashboards when search criteria has been met for the underlying correlation searches and when notable events are generated. Other content does not appear until notable events are generated matching assets in the asset list (a table with information about the assets in the environment).
Domain add-ons
Domain add-ons provide dashboards, views, and correlation searches that give visibility into the primary domains of security:
- Access protection
- Endpoint protection
- Network protection
Each domain includes summary dashboards that give an overview of important security metrics, along with search views that make it possible to drill down to more detailed information. These views act as interactive starting points to investigate and explore the data to discover abnormal behavior.
- Access Summary domain
- Provides information about authentication attempts and access control related events (login, logout, access allowed, access failure, use of default accounts, and so on).
- Endpoint Summary domain
- Information about endpoints such as malware infections, system configuration, system state (CPU usage, open ports, uptime, and so on), system update history (which updates have been applied), and time synchronization information.
- Network Summary domain
- Information about network traffic provided from devices such as firewalls, routers, and network-based intrusion detection systems.
Supporting add-ons
Supporting add-ons provide tools and knowledge that help monitor and investigate the security of the infrastructure:
- Identity Correlation: This provides information about the asset management and session management systems in the Splunk App for Enterprise Security. It includes Identity Center and identity correlation capabilities.
- Audit & Data Protection: This provides information about Splunk's operational data including: forwarder auditing, index auditing, search auditing, and data protection. This shows how the Splunk App for Enterprise Security is being used in the current environment, and whether is is being used effectively.
- Resources: These are additional resources related to Splunk and to data security, including generic Splunk search capability, a view of Splunk indexes, and informational dashboards about the Splunk App for Enterprise Security. Also includes a Threat Intelligence section, with direct links to security resources on the Web.
Add-ons
Add-ons provide a layer of abstraction that forms the link between data from specific technologies such as McAfee data or Juniper firewall logs and the higher-level apps and add-ons in Splunk for Enterprise Security. The add-ons contain search-time knowledge mapping, which is configuration that tells Splunk how to recognize fields and tags in the data that are expected by the higher-level correlation searches and reports. Some of the add-ons contain feeds as well. This assignment of tags and fields allows higher-level apps to be "data-agnostic" and to handle all similar data identically regardless of where it originated.
What add-ons do
Each add-on contains search time knowledge mapping specific to a the data format generated by a specific technology:
- When data is added to Splunk, Splunk assigns a source type based on the data format and the originating technology. The Splunk App for Enterprise Security uses this source type information, along with the search time knowledge mapping in the add-on. For some classes of data sources, Splunk and the Splunk App for Enterprise Security can determine the source type; for other classes of data sources, you must explicitly specify the source type when you create the Splunk data input.
- A minority of add-ons deal with with complex or ambiguous data. In this case configuration to enhance Splunk's universal indexing, extracting correct timestamps from incomplete or non-standard time formats, determining event boundaries for multi-line data, and optimizing the data representation in the index for search speed and performance is supplied by add-ons.
- During searches Splunk uses field extractions and tagging configuration from add-ons to know how to normalize normalize the data, including tagging data (for example, firewall data vs. malware data) and identifying fields used by the dashboards and searches (for example, identifying the source and destination of an action).
Add-ons rely heavily on the Splunk source type that has been assigned to the data, so during installation it is important to ensure that this is set up correctly. Installing Enterprise Security onto a dedicated Search Head makes this process easier. In addition, add-ons can be modified to match existing source types.
How to get add-ons
Each add-on is specific to a single technology, or version of a technology, and provides all the Splunk knowledge necessary to incorporate that technology into Enterprise Security. You can use pre-packaged add-ons or create your own. See the Data Source Integration manual for information on creating your own add-ons.
Note: Not all apps and add-ons are compatible with the Splunk App for Enterprise Security. Only those that explicitly state they are Enterprise Security-compatible should be installed on the same search head with the Splunk App for Enterprise Security.
- Add-ons for a number of common source types are bundled with the Splunk App for Enterprise Security. Some of these add-ons may need to be configured for your environment. Each add-on contains a README file that details the required configurations.
- Splunk Apps hosts downloadable apps and add-ons for Splunk.
- You can develop your own add-ons for unsupported or custom data formats, including your own application logs.
See the Data Source Integration manual for more information. You are also encouraged to upload your add-ons to Splunk Apps and share them with the Splunk community. To share your add-ons, go to Splunk Apps, click upload an app and follow the instructions for the upload.
Add-ons are designed to be as easy as possible to deploy, but some supported technologies may require additional configuration. This is especially true if you have customized the format of your logs or other data sources.
Splunk App for Enterprise Security file structure
The Splunk App for Enterprise Security is composed of a series of underlying apps, each of which is implemented as a subdirectory of the $SPLUNK_HOME/etc/apps/ (*Nix) or $SPLUNK_HOME\etc\apps (Windows) directory in Splunk.
The following table shows the location of the Enterprise Security files within the Splunk directory structure.
| Path under $SPLUNK_HOME | Description |
|---|---|
| etc/apps/SplunkEnterpriseSecuritySuite etc\apps\SplunkEnterpriseSecuritySuite |
Contains the core components of the Spunk App for Enterprise Security |
| etc/apps/DA-* etc\apps\DA-* |
Each DA directory provides the underlying functionality for one of the domains in Splunk for Enterprise Security, including the saved searches, macros, and lookups. For example, the "DA-EndpointProtection" directory contains the functionality for the Endpoint protection domain. |
| etc/apps/SA- etc\apps\SA-* |
Each SA directory provides the underlying support modules for a specific area of knowledge used by the domains in Splunk for Enterprise Security. |
| etc/apps/TA-* etc\apps\TA-* |
Each TA directory contains the files for a specific technology supported by Splunk for Enterprise Security. These files include the content necessary to optimize, normalize, and categorize data inputs. |
Notable events
When a correlation search included in the Splunk App for Enterprise Security (or added by a user) identifies an event or pattern of events, it creates a notable event. Correlation searches filter the IT security data and correlate across events to identify a particular type of incident (or pattern of events) and then create notable events. The app includes pre-configured correlation searches to create notable events, and lets you add your own.
Correlation searches run at regular intervals (for example every hour) or continuously in real-time and search events for a particular pattern or type of activity. The notable event is stored in a dedicated notable index, which is implemented as a summary index in Splunk. The Incident Review dashboard is used to view and act on notable events. A notable event may be a single event of high importance, such as any activity from a known web attacker, or an aggregate of multiple events that together warrant review, such as a high number of authentication failures on a single host followed by a successful authentication.
When notable events are created, relevant information from the asset list is combined with the event information. To help to further identify important patterns, correlation searches are each assigned a "severity" (informational, low, medium, high, or critical). Notable events are assigned an "urgency", based on the severity of the event and the priority of the asset corresponding to the event.
Note: Correlation searches will use either the severity of the search definition or the severity of the event (if the field "severity" is persisted when generating notable events.
For more information, see "Correlation searches and calculated severity" in the Splunk App for Enterprise Security User Manual.
| How to get support and find more information about Splunk | Plan your deployment |
This documentation applies to the following versions of Splunk® Enterprise Security: 3.0, 3.0.1


 Download manual
Feedback submitted, thanks!